

วิธีสร้างเว็บแอปเพื่อติดตามผลการทดลองตามผลิตภัณฑ์
เรียนรู้วิธีสร้างเว็บแอปเพื่อติดตามผลการทดลองข้ามผลิตภัณฑ์: โมเดลข้อมูล เมตริก การอนุญาต การผสานรวม แดชบอร์ด และการรายงานที่เชื่อถือได้
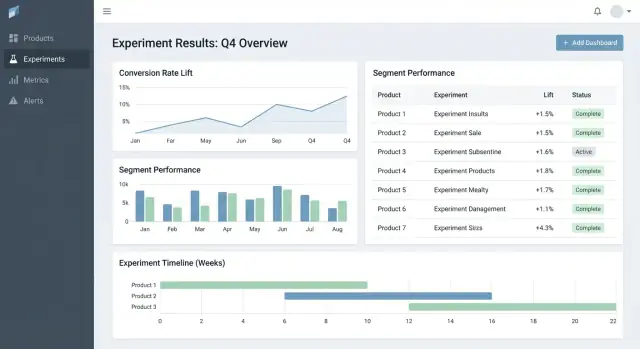
What this web app should solve
Most teams don’t fail at experimentation because they lack ideas—they fail because results are scattered. One product has charts in an analytics tool, another has a spreadsheet, a third has a slide deck with screenshots. A few months later, nobody can answer simple questions like “Did we already test this?” or “Which version won, using which metric definition?”
The core problem: fragmented results and inconsistent truth
An experiment tracking web app should centralize what was tested, why, how it was measured, and what happened—across multiple products and teams. Without this, teams waste time rebuilding reports, arguing about numbers, and re-running old tests because learnings aren’t searchable.
Who it’s for (and what each group needs)
This isn’t just an analyst tool.
- Product managers need a fast way to see outcomes, confidence, and decision status.
- Analysts need a reliable place to document assumptions, metric definitions, and caveats.
- Engineers need clarity on which feature flags, variants, and rollout conditions were in scope.
- Leadership needs a consistent view of impact across products, without bespoke decks.
Outcomes to optimize for
A good tracker creates business value by enabling:
- Faster decisions (less time chasing links and approvals)
- Fewer reporting errors (one source of truth for “the final numbers”)
- Shared learnings (searchable history of wins, losses, and neutral tests)
Clear scope boundaries
Be explicit: this app is primarily for tracking and reporting experiment results—not for running experiments end-to-end. It can link out to existing tools (feature flagging, analytics, data warehouse) while owning the structured record of the experiment and its final, agreed interpretation.
Requirements: the minimum viable experiment tracker
A minimum viable experiment tracker should answer two questions without hunting through docs or spreadsheets: what are we testing and what did we learn. Start with a small set of entities and fields that work across products, then expand only when teams feel real pain.
Core entities to support
Keep the data model simple enough that every team uses it the same way:
- Product: the surface area (app/site/API) where the change ships.
- Experiment: one hypothesis and one decision.
- Variant: control and one or more treatments.
- Metric: a named measurement with an owner and definition.
- Segment: optional audience slices (new users, paid users, region) used for reporting.
Experiment types (start small, stay flexible)
Support the most common patterns from day one:
- A/B tests (control vs treatment)
- Multivariate tests (multiple variants)
- Feature flag rollouts (percentage-based exposure)
Even if rollouts don’t use formal statistics at first, tracking them alongside experiments helps teams avoid repeating the same “tests” with no record.
Minimum fields every experiment needs
At creation time, require only what’s needed to run and interpret the test later:
- Hypothesis (what change, for whom, and why)
- Owner (single accountable person)
- Start/end dates (planned and actual)
- Targeting (eligibility rules) and allocation (traffic split)
- Links to rollout/flag, ticket, or spec (relative URLs like /projects/123)
Success criteria and decision status
Make results comparable by forcing structure:
- Primary metric (the main success measure)
- Guardrails (metrics that must not worsen)
- Decision status: proposed → running → analyzed → shipped/rolled back → archived
If you build just this, teams can reliably find experiments, understand setup, and record outcomes—even before you add advanced analytics or automation.
Data model that works across multiple products
A cross-product experiment tracker succeeds or fails on its data model. If IDs collide, metrics drift, or segments are inconsistent, your dashboard can look “right” while telling the wrong story.
Choose stable identifiers (and stick to them)
Start with a clear identifier strategy:
- product_id: stable across renames (don’t use display names as keys)
- experiment_key: human-friendly slug (e.g.,
checkout_free_shipping_banner) plus an immutable experiment_id - variant_key: stable labels like
control,treatment_a
This lets you compare results across products without guessing whether “Web Checkout” and “Checkout Web” are the same thing.
Core collections/tables
Keep the core entities small and explicit:
- experiments: product_id, hypothesis, primary_metric_def_id, start/end, status
- variants: experiment_id, variant_key, traffic_split
- assignments: experiment_id, user_id (or anonymous_id), variant_key, assigned_at
- metric_defs: metric name, numerator/denominator logic, unit (user/session/order), owner
- results: experiment_id, metric_def_id, time_window_id, segment_id, computed_at, effect, uncertainty
Even if computation happens elsewhere, storing the outputs (results) enables fast dashboards and a reliable history.
Time windows and versioning
Metrics and experiments aren’t static. Model:
- time windows (e.g., “first 7 days after assignment”, “calendar weeks”)
- versioned metric definitions: when a metric’s calculation changes, create a new version rather than editing the old one
This prevents last month’s experiments from changing when someone updates KPI logic.
Segments and an audit trail
Plan for consistent segments across products: country, device, plan tier, new vs returning.
Finally, add an audit trail capturing who changed what and when (status changes, traffic splits, metric definition updates). It’s essential for trust, reviews, and governance.
Metric definitions and consistent calculations
If your experiment tracker gets metric math wrong (or inconsistent across products), the “result” is just an opinion with a chart. The fastest way to prevent this is to treat metrics as shared product assets—not ad‑hoc query snippets.
Build a canonical metric catalog
Create a metric catalog that is the single source of truth for definitions, calculation logic, and ownership. Each metric entry should include:
- A plain-English definition (what decision it supports)
- An owner (the person/team responsible for changes)
- The exact formula and required events/fields
- Inclusion/exclusion rules (e.g., internal users, bots, refunded orders)
- Valid aggregation levels and supported products
Keep the catalog close to where people work (e.g., linked from your experiment creation flow) and version it so you can explain historical results.
Standardize aggregation levels
Decide up front what “unit of analysis” each metric uses: per user, per session, per account, or per order. A conversion rate “per user” can disagree with “per session” even when both are correct.
To reduce confusion, store the aggregation choice with the metric definition, and require it when an experiment is set up. Don’t let each team pick a unit ad hoc.
Handle delayed conversions and attribution
Many products have conversion windows (e.g., signup today, purchase within 14 days). Define attribution rules consistently:
- When does the clock start (exposure time, first visit, assignment time)?
- What counts as a conversion if a user is exposed multiple times?
- How do you handle cross-device or cross-product journeys?
Make these rules visible in the dashboard so readers know what they’re looking at.
Store raw counts and computed stats
For fast dashboards and auditability, store both:
- Raw counts (exposures, converters, revenue sums, variance inputs)
- Computed statistics (lift, confidence intervals, p-values)
This enables quick rendering while still letting you recompute when definitions change.
Naming conventions prevent metric sprawl
Adopt a naming standard that encodes meaning (e.g., activation_rate_user_7d, revenue_per_account_30d). Require unique IDs, enforce aliases, and flag near-duplicates during metric creation to keep the catalog clean.
Collecting data: events, pipelines, and quality checks
Your experiment tracker is only as credible as the data it ingests. The goal is to reliably answer two questions for every product: who was exposed to which variant, and what did they do afterward? Everything else—metrics, statistics, dashboards—depends on that foundation.
Pick an ingestion approach
Most teams choose one of these patterns:
- Event stream (near real-time): Great for quick reads and faster debugging. Requires more engineering maturity to keep stable.
- Daily batch: Simpler to operate and cheaper. Best when decisions don’t need to happen hourly.
- Hybrid: Stream exposures and critical events (so you can validate assignments quickly), batch the rest for completeness and cost control.
Whatever you pick, standardize the minimum event set across products: exposure/assignment, key conversion events, and enough context to join them (user ID/device ID, timestamp, experiment ID, variant).
Map product events to metrics (and validate completeness)
Define a clear mapping from raw events to metrics your tracker reports (e.g., purchase_completed → Revenue, signup_completed → Activation). Maintain this mapping per product, but keep naming consistent across products so your A/B test results dashboard compares like with like.
Validate completeness early:
- Confirm every exposure has an experiment ID and variant.
- Ensure conversion events include the same identity fields used for exposure joins.
- Watch for event drop-offs between client, server, and warehouse (mobile SDKs are common culprits).
Data quality checks you should automate
Build checks that run on every load and fail loudly:
- Missing exposure events: conversions with no prior exposure (often instrumentation gaps or identity mismatches).
- Skewed allocations: variants receiving 70/30 when you expected 50/50 (can indicate targeting bugs).
- Timestamp sanity: exposures after conversions, or large delays suggesting clock issues.
Surface these in the app as warnings attached to an experiment, not hidden in logs.
Backfills and reprocessing
Pipelines change. When you fix an instrumentation bug or dedupe logic, you’ll need to reprocess historical data to keep metrics and KPIs consistent.
Plan for:
- Versioned transformations (so you know which logic produced which result).
- Safe backfills (limit scope by date/product/experiment).
- An audit trail of recomputation.
Document integrations
Treat integrations as product features: document supported SDKs, event schemas, and troubleshooting steps. If you have a docs area, link it as a relative path like /docs/integrations.
Statistics and result computation you can trust
If people don’t trust the numbers, they won’t use the tracker. The goal isn’t to impress with math—it’s to make decisions repeatable and defensible across products.
Pick one statistical “dialect” and stick to it
Decide upfront whether your app will report frequentist results (p-values, confidence intervals) or Bayesian results (probability of improvement, credible intervals). Both can work, but mixing them across products causes confusion (“Why does this test show 97% chance to win, while that one shows p=0.08?”).
A practical rule: choose the approach your org already understands, then standardize terminology, defaults, and thresholds.
Define exactly what the UI shows
At a minimum, your results view should make these items unambiguous:
- Lift (absolute and/or relative) versus control
- Interval (confidence interval or credible interval) shown as a range, not just a point estimate
- Strength of evidence (p-value for frequentist, or probability of beating control for Bayesian)
Also show the analysis window, units counted (users, sessions, orders), and the metric definition version used. These “details” are the difference between consistent reporting and debate.
Multiple comparisons and “peeking” policies
If teams test many variants, many metrics, or check results daily, false positives become likely. Your app should encode a policy rather than leaving it to each team:
- Multiple comparisons: decide whether you adjust (e.g., control false discovery rate) or you clearly label results as “unadjusted exploratory.”
- Repeated peeking: either (1) discourage it with a fixed end date and “finalized” status, or (2) support sequential methods and show “safe-to-stop” guidance.
Guardrails that catch common failure modes
Add automated flags that appear next to results, not hidden in logs:
- Sample Ratio Mismatch (SRM): warn when traffic split deviates from the expected allocation.
- Anomaly detection: flag sudden drops/spikes in traffic, conversions, or revenue that could indicate tracking breaks, outages, or bot traffic.
Plain-language explanations
Next to the numbers, add a short explanation that a non-technical reader can trust, such as: “The best estimate is +2.1% lift, but the true effect could plausibly be between -0.4% and +4.6%. We don’t have strong enough evidence to call a winner yet.”
UX and dashboards for quick decision-making
Good experiment tooling helps people answer two questions quickly: What should I look at next? and What should we do about it? The UI should minimize hunting for context and make “decision state” explicit.
Key pages to anchor the workflow
Start with three pages that cover most usage:
- Experiments list: a sortable queue for the whole org (or per product).
- Experiment detail: the single source of truth for setup, results, and decision.
- Product overview: a rollup of active tests, recent decisions, and metric health for one product.
On the list and product pages, make filters fast and sticky: product, owner, date range, status, primary metric, and segment. People should be able to narrow to “Checkout experiments, owned by Maya, running this month, primary metric = conversion, segment = new users” in seconds.
Decision states people can trust
Treat status as a controlled vocabulary, not free text:
Draft → Running → Stopped → Shipped / Rolled back
Show status everywhere (list rows, detail header, and share links) and record who changed it and why. This prevents “quiet launches” and unclear outcomes.
A results table that makes the call obvious
In the experiment detail view, lead with a compact results table per metric:
- Baseline
- Variant
- Lift
- Uncertainty (confidence interval or credible interval)
- Notes (e.g., instrumentation caveats, segment quirks)
Keep advanced charts behind a “More details” section so decision-makers aren’t overwhelmed.
Sharing and exports without losing control
Add CSV export for analysts and shareable links for stakeholders, but enforce access: links should respect roles and product permissions. A simple “Copy link” button plus an “Export CSV” action covers most collaboration needs.
Permissions, privacy, and governance
If your experiment tracker spans multiple products, access control and auditability are not optional. They’re what makes the tool safe to adopt across teams and credible during reviews.
Role-based access control (RBAC)
Start with a simple set of roles and keep them consistent across the app:
- Viewer: read-only access to experiments, results, and dashboards.
- Editor: create/edit experiments, upload supporting docs, set status (draft → running → concluded).
- Admin: manage users, permissions, metric definitions, retention rules, and integrations.
Keep RBAC decisions centralized (one policy layer), so the UI and API enforce the same rules.
Product-level and row-level permissions
Many orgs need product-scoped access: Team A can see Product A experiments but not Product B. Model this explicitly (e.g., user ↔ product memberships), and ensure every query is filtered by product.
For sensitive cases (e.g., partner data, regulated segments), add row-level restrictions on top of product scoping. A practical approach is tagging experiments (or result slices) with a sensitivity level and requiring an additional permission to view them.
Audit trail: access + change history
Log two things separately:
- Change logs: who edited an experiment, metric definition, or decision—what changed and when.
- Access logs: who viewed or exported results (especially for sensitive experiments).
Expose the change history in the UI for transparency, and keep deeper logs available for investigations.
Retention and deletion rules
Define retention rules for:
- Experiment metadata (hypothesis, owners, dates, decision notes)
- Computed results (effect sizes, confidence intervals, significance flags)
Make retention configurable by product and sensitivity. When data must be removed, keep a minimal tombstone record (ID, deletion time, reason) to preserve reporting integrity without retaining sensitive content.
Workflow features: from idea to learning library
A tracker becomes truly useful when it covers the full experiment lifecycle, not just the final p-value. Workflow features turn scattered docs, tickets, and charts into a repeatable process that improves quality and makes learnings easy to reuse.
Lifecycle workflow: idea → review → run → post‑mortem
Model experiments as a series of states (Draft, In Review, Approved, Running, Ended, Readout Published, Archived). Each state should have clear “exit criteria” so experiments don’t go live without essentials like a hypothesis, primary metric, and guardrails.
Approvals don’t need to be heavy. A simple reviewer step (e.g., product + data) plus an audit trail of who approved what and when can prevent avoidable mistakes. After completion, require a short post‑mortem before an experiment can be marked “Published” to ensure results and context are captured.
Templates that standardize thinking
Add templates for:
- Experiment brief (goal, hypothesis, target audience, success metrics, guardrails, rollout plan)
- Analysis notes (data sources, exclusions, sanity checks, interpretation, risks)
Templates reduce “blank page” friction and make reviews faster because everyone knows where to look. Keep them editable per product while preserving a common core.
Learnings: link everything, keep it searchable
Experiments rarely live alone—people need the surrounding context. Let users attach links to tickets/specs and related writeups (for example: /blog/how-we-define-guardrails, /blog/experiment-analysis-checklist). Store structured “Learning” fields like:
- What changed (decision)
- What we learned (insight)
- What to do next (follow-up)
Alerts for guardrails and changing results
Support notifications when guardrails regress (e.g., error rate, cancellations) or when results change materially after late data or metric recalculation. Make alerts actionable: show the metric, threshold, timeframe, and an owner to acknowledge or escalate.
A library view to reuse past work
Provide a library that filters by product, feature area, audience, metric, outcome, and tags (e.g., “pricing,” “onboarding,” “mobile”). Add “similar experiments” suggestions based on shared tags/metrics so teams can avoid rerunning the same test and instead build on prior learnings.
Architecture and tech stack options
You don’t need a “perfect” stack to build an experiment tracking web app—but you do need clear boundaries: where data lives, where calculations run, and how teams access results consistently.
A practical baseline stack
For many teams, a simple and scalable setup looks like:
- Frontend: React (or Vue) for dashboards and workflows
- Backend API: Node.js/Express, Python/FastAPI, or Java/Spring—pick what your team can maintain
- Database: Postgres for app data (experiments, metric definitions, permissions)
- Analytics warehouse: BigQuery/Snowflake/Redshift for event data and heavy aggregations
This split keeps transactional workflows fast while letting the warehouse handle large-scale computation.
If you want to prototype the workflow UI quickly (experiments list → detail → readout) before committing to a full engineering cycle, a vibe-coding platform like Koder.ai can help you generate a working React + backend foundation from a chat spec. It’s especially useful for getting the entities, forms, RBAC scaffolding, and audit-friendly CRUD in place, then iterating on the data contracts with your analytics team.
Where should metric calculations live?
You typically have three options:
- Warehouse-first: SQL models compute metrics and experiment result tables. The app mostly reads.
- Backend jobs: A worker computes results on schedules or when experiments change.
- Hybrid: Canonical aggregations in the warehouse, with backend post-processing (formatting, guardrails, caching).
Warehouse-first is often simplest if your data team already owns trusted SQL. Backend-heavy can work when you need low-latency updates or custom logic, but it increases application complexity.
Performance: cache and precompute
Experiment dashboards often repeat the same queries (top-line KPIs, time series, segment cuts). Plan to:
- Precompute rollups (daily metric aggregates per experiment/variant/segment)
- Cache expensive reads at the API layer (e.g., Redis) with clear invalidation rules
- Use materialized views or scheduled tables in the warehouse for common dashboards
Multi-tenant vs single-tenant
If you support many products or business units, decide early:
- Single-tenant (shared schema): Easier to operate, but requires strict permission filtering.
- Multi-tenant: Separate schemas/projects per product/team for stronger isolation, more overhead.
A common compromise is shared infrastructure with a strong tenant_id model and enforced row-level access.
Define the core APIs
Keep the API surface small and explicit. Most systems need endpoints for experiments, metrics, results, segments, and permissions (plus audit-friendly reads). This makes it easier to add new products without rewriting the plumbing.
Testing, monitoring, and reliable operations
An experiment tracker is only useful if people trust it. That trust comes from disciplined testing, clear monitoring, and predictable operations—especially when multiple products and pipelines feed the same dashboards.
Observability that matches how people use the app
Start with structured logging for every critical step: event ingestion, assignment, metric rollups, and result computation. Include identifiers like product, experiment_id, metric_id, and pipeline run_id so support can trace a single result back to its inputs.
Add system metrics (API latency, job runtimes, queue depth) and data metrics (events processed, % late events, % dropped by validation). Complement this with tracing across services so you can answer, “Why is this experiment missing yesterday’s data?”
Data freshness checks are the fastest way to prevent silent failures. If an SLA is “daily by 9am,” monitor freshness per product and per source, and alert when:
- the latest partition is missing
- event volume deviates sharply from baseline
- rollup jobs finish but produce zero rows
Automated tests: protect the data and the math
Create tests at three levels:
- Schema and constraints: required fields, uniqueness (e.g., one assignment per user per experiment), foreign keys, and valid date ranges.
- Permissions: role-based access tests (viewer/editor/admin), and product scoping so teams only see what they should.
- Result math: unit tests for lift, confidence intervals, significance flags, and edge cases (small samples, zero denominators, multiple variants).
Keep a small “golden dataset” with known outputs so you can catch regressions before shipping.
Deployments, migrations, and historical safety
Treat migrations as part of operations: version your metric definitions and result computation logic, and avoid rewriting historical experiments unless explicitly requested. When changes are required, provide a controlled backfill path and document what changed in an audit trail.
Admin tools for incidents and reprocessing
Provide an admin view to re-run a pipeline for a specific experiment/date range, inspect validation errors, and mark incidents with status updates. Link incident notes directly from affected experiments so users understand delays and don’t make decisions on incomplete data.
Rollout plan and common pitfalls to avoid
Rolling out an experiment tracking web app across products is less about “launch day” and more about steadily reducing ambiguity: what’s tracked, who owns it, and whether the numbers match reality.
A practical rollout sequence
Start with one product and a small, high-confidence metric set (for example: conversion, activation, revenue). The goal is to validate your end-to-end workflow—creating an experiment, capturing exposure and outcomes, calculating results, and recording the decision—before you scale complexity.
Once the first product is stable, expand product-by-product with a predictable onboarding cadence. Each new product should feel like a repeatable setup, not a custom project.
If your organization tends to get stuck in long “platform build” cycles, consider a two-track approach: build the durable data contracts (events, IDs, metric definitions) in parallel with a thin application layer. Teams sometimes use Koder.ai to stand up that thin layer quickly—forms, dashboards, permissions, and export—then harden it as adoption grows (including source code export and iterative rollbacks via snapshots when requirements change).
Rollout checklist for each new product
Use a lightweight checklist to onboard products and event schemas consistently:
- Confirm event taxonomy and naming conventions (and who can change them)
- Verify exposure events exist and are uniquely attributable to a user/session
- Map metrics to the product’s event schema (including edge cases like refunds, cancellations)
- Run a backfill or parallel-run period to compare with existing analytics
- Assign ownership for experiment setup, data validation, and final decision notes
Where it helps adoption, link “next steps” from experiment results to relevant product areas (for example, pricing-related experiments can link to /pricing). Keep links informative and neutral—no implied outcomes.
Track adoption so you can fix friction early
Measure whether the tool is becoming the default place for decisions:
- Weekly active users by role (PM, analyst, engineer)
- Experiments created and completed
- Percentage with decision notes filled in (not just results viewed)
- Time from experiment end → decision recorded
Common pitfalls to avoid
In practice, most rollouts stumble on a few repeat offenders:
- Inconsistent metric definitions across products (same name, different math)
- Missing or flawed exposure tracking, leading to biased results
- Unclear ownership for validation and sign-off, causing “zombie experiments”
- Quiet schema changes that break trends without anyone noticing
- Scaling to many metrics too early, before the core workflow is trusted
คำถามที่พบบ่อย
What problem is an experiment tracking web app actually solving?
เริ่มจากการรวม บันทึกฉบับสุดท้ายที่ตกลงกันแล้ว ของแต่ละการทดลองไว้ที่เดียว:
- สิ่งที่ทดสอบ (สมมติฐาน, ตัวแปร)
- สถานที่ที่รัน (product)
- วิธีการวัด (คำนิยามเมตริก + เวอร์ชัน)
- ผลลัพธ์ที่เกิดขึ้น (ผล, ความไม่แน่นอน, การตัดสินใจ)
คุณอาจเชื่อมโยงไปยังเครื่องมือฟีเจอร์แฟล็กหรือระบบวิเคราะห์อื่น ๆ แต่ tracker ควรเป็นเจ้าของประวัติเชิงโครงสร้างเพื่อให้ผลลัพธ์ค้นหาและเปรียบเทียบได้ตามเวลา
Does an experiment tracker need to run experiments end-to-end?
ไม่จำเป็น—ให้ขอบเขตเน้นที่ การติดตามและรายงาน ผลการทดลอง:
A practical MVP:
- เก็บเมตาดาต้าการทดลอง (owner, วันที่, การกำหนดเป้าหมาย, การแบ่งทราฟฟิก)
- เก็บคำนิยามเมตริก (แบบมีเวอร์ชัน)
- เก็บผลลัพธ์ที่คำนวณแล้ว (lift + ความไม่แน่นอน) และบันทึกการตัดสินใจ
- ลิงก์ไปยังระบบภายนอก (flags, ตั๋ว, แดชบอร์ด)
วิธีนี้ช่วยแก้ปัญหา "ผลกระจัดกระจาย" โดยไม่ต้องสร้างแพลตฟอร์มการทดลองทั้งระบบใหม่
What core entities should the MVP data model include?
โมเดลขั้นต่ำที่ใช้งานได้ข้ามทีมคือ:
- Product (มี
product_idที่คงที่) - Experiment (มี
experiment_idคงที่ +experiment_keyที่อ่านง่าย) - Variant (
control,treatment_a, เป็นต้น) - Metric definition (มี owner, สูตร, หน่วย, เวอร์ชัน)
- Results (effect + ความไม่แน่นอน ต่อ metric/segment/window)
เพิ่ม Segment และ Time window ตั้งแต่ต้นหากคุณคาดว่าจะต้องตัดแบ่งข้อมูลอย่างสม่ำเสมอ (เช่น new vs returning, 7-day vs 30-day)
How should we design identifiers so results stay consistent across products?
ใช้ ID ที่เสถียรและถือเป็นกฎ: ให้ชื่อที่แสดง (display names) แก้ไขได้แต่ตัวระบุหลักต้องคงที่:
product_id: ห้ามเปลี่ยนแม้ชื่อผลิตภัณฑ์เปลี่ยนexperiment_id: ID ภายในที่ไม่เปลี่ยนแปลงexperiment_key: slug ที่อ่านง่าย (บังคับให้เป็นเอกลักษณ์ต่อ product ได้)variant_key: สตริงคงที่ เช่นcontrol,treatment_a
วิธีนี้จะป้องกันการชนกันและทำให้การรายงานข้ามผลิตภัณฑ์เชื่อถือได้เมื่อชื่อเรียกเปลี่ยนแปลงไป
What fields should be required when creating an experiment?
เมื่อสร้างการทดลอง ให้ระบุตัวชี้วัดความสำเร็จตั้งแต่ต้น:
- บังคับให้มี primary metric หนึ่งตัว (ตัวขับการตัดสินใจ)
- กำหนด guardrails (เมตริกที่ต้องไม่แย่ลง)
- เก็บ decision status ที่ถูกควบคุม (เช่น Draft → Running → Analyzed → Shipped/Rolled back → Archived)
โครงสร้างนี้ช่วยลดการถกเถียงภายหลังเพราะผู้อ่านเห็นชัดเจนว่า "ชนะ" หมายถึงอะไรตั้งแต่ก่อนรันการทดลอง
How do we prevent inconsistent metric definitions across teams?
สร้างคาตาล็อกเมตริกแบบเป็นศูนย์กลางที่มี:
- คำอธิบายเป็นภาษาธรรมดา + จุดประสงค์ในการตัดสินใจ
- สูตรที่ชัดเจนและเหตุการณ์/ฟิลด์ที่ต้องการ
- กฎการรวม/ยกเว้น (เช่น ผู้ใช้ภายใน, บ็อต, คำสั่งคืนเงิน)
- หน่วยการวิเคราะห์ (user/session/order/account)
- เจ้าของและ เวอร์ชัน
เมื่อเปลี่ยนตรรกะ ให้เผยแพร่เป็นเวอร์ชันใหม่แทนการแก้ไขประวัติ แล้วเก็บว่าแต่ละการทดลองใช้เวอร์ชันไหน
What’s the minimum instrumentation and data quality checks we need?
ขั้นต่ำที่ต้องมีสำหรับการเชื่อมโยงอย่างน่าเชื่อถือคือ:
- เหตุการณ์ assignment/exposure ที่มี experiment ID และ variant
- เหตุการณ์ conversion หลักที่มีฟิลด์ตัวตนที่เข้ากันได้ (user/device/account)
- เวลาที่เชื่อถือได้สำหรับหน้าต่างการ atribuition
จากนั้นอัตโนมัติการตรวจสอบเช่น:
- การขาด exposure (conversion ที่ไม่มีการ assignment ก่อนหน้า)
- การแบ่งสัดส่วนที่เบี้ยว (allocation skew)
- ความสมเหตุสมผลของ timestamp (exposure หลัง conversion)
แสดงสิ่งเตือนเหล่านี้บนหน้าการทดลองเพื่อให้มองเห็นได้ง่าย
Should we use frequentist or Bayesian stats in the tracker?
เลือก "สำเนียงสถิติ" หนึ่งแบบและยึดตามมัน:
- Frequentist: p-values + confidence intervals
- Bayesian: probability of improvement + credible intervals
ไม่ว่าคุณจะเลือกแบบไหน ให้แสดงอย่างน้อย:
- lift เทียบกับ control
- ช่วงค่าประมาณ (interval) ไม่ใช่แค่จุดเดียว
- หน้าต่างการวิเคราะห์, หน่วยการนับ, และเวอร์ชันคำนิยามเมตริก
ความสม่ำเสมอสำคัญกว่าความซับซ้อนเมื่อจะสร้างความไว้วางใจในองค์กร
What permissions and governance features are essential for a cross-product tracker?
จัดการสิทธิ์เป็นเรื่องพื้นฐาน ไม่ใช่ของที่ค่อยเพิ่มทีหลัง:
- RBAC: Viewer / Editor / Admin
- การเข้าถึงตาม product: ผู้ใช้เห็นเฉพาะ product ที่พวกเขาเป็นสมาชิก
- ตัวเลือก ข้อจำกัดระดับแถว สำหรับการทดลองที่มีความอ่อนไหว
เก็บสองบันทึกหลัก:
- change history (ใครแก้สถานะ/ฟิลด์/ผล และเมื่อไร)
- access/export logs (ใครดูหรือส่งออกผลที่ละเอียดอ่อน)
นี่คือสิ่งที่จะทำให้ tracker ปลอดภัยในการนำไปใช้ข้ามทีมและผลิตภัณฑ์
How should we roll out the tracker, and what pitfalls should we watch for?
ไล่ทำเป็นลำดับซ้ำได้:
- เริ่มที่ หนึ่งผลิตภัณฑ์ กับชุดเมตริกเล็ก ๆ (เช่น conversion, activation, revenue)
- ยืนยัน end-to-end: assignment → joins → metrics → results → decision notes
- ขยายทีละผลิตภัณฑ์โดยใช้เช็คลิสต์ onboarding เดียวกัน
หลีกเลี่ยงปัญหาทั่วไป:
- เมตริกชื่อเดียวแต่สูตรต่างกัน
- ขาดการติดตาม exposure ทำให้ผลลัพธ์มีอคติ
- ความไม่ชัดเจนเรื่องความเป็นเจ้าของทำให้เกิด "zombie experiments"
- ขยายจำนวนเมตริกมากเกินไปก่อนที่ workflow หลักจะเชื่อถือได้