

AI-Assisted vs Traditional Debugging: Workflows Compared
Compare AI-assisted and traditional debugging workflows: speed, accuracy, learning value, risks, costs, and how to combine both for reliable fixes.
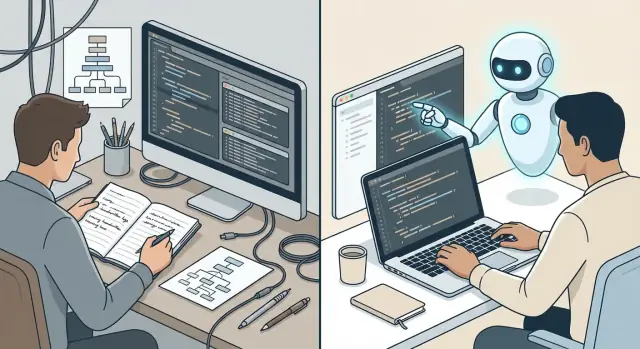
What We Mean by AI-Assisted vs Human-Led Debugging
A “debugging workflow” is the repeatable path from noticing a problem to preventing it from happening again. Most teams—regardless of tools—move through the same core steps: reproduce the bug, isolate where it originates, fix the underlying cause (not just the symptom), verify the fix with tests and real-world checks, and prevent regressions with guardrails like monitoring, better test coverage, and clearer runbooks.
AI-assisted debugging
“AI-assisted” means using an LLM-based helper to speed up parts of that workflow without handing over full responsibility. In practice, this can look like:
- Chat-style help to interpret error messages, stack traces, and logs
- IDE copilots suggesting likely fixes, refactors, or missing null checks
- Summaries of log files, crash reports, or incident timelines
- Generating hypotheses (“this looks like a race condition”) and proposing targeted experiments
The key point: the model is a support tool. It can propose patterns and next steps, but it doesn’t inherently know your system’s real runtime behavior, data, or constraints unless you provide that context.
Human-led debugging
“Human-led” means the developer drives the investigation primarily through manual reasoning and evidence gathering, using established engineering tools and team practices. Typical elements include:
- Reproducing the issue locally or in a staging environment
- Stepping through code with a debugger, adding tracing, or inspecting metrics
- Narrowing scope via controlled experiments and code reading
- Peer review to validate the fix and catch unintended side effects
This approach emphasizes accountability and verification: conclusions are tied to what you can observe and test.
Setting expectations for this comparison
This article isn’t about declaring a universal winner. AI help can accelerate triage and idea generation, while human-led methods anchor decisions in system knowledge, constraints, and proof. The practical question is: which parts of the workflow benefit from AI speed, and which require human rigor and validation?
A Quick Map of the Traditional Debugging Workflow
Traditional debugging is a disciplined loop: you take a vague symptom (an alert, a user report, a failing build) and turn it into a specific, testable explanation—then a verified fix. While every team has its own flavor, the steps are remarkably consistent.
The typical steps
First is triage: assess severity, scope, and who owns it. Then you try to reproduce the issue—locally, in staging, or by replaying production inputs. Once you can see it fail on demand, you inspect signals (logs, stack traces, metrics, recent deploys) and form a hypothesis about the cause.
Next comes testing the hypothesis: add a temporary log, write a minimal test, toggle a feature flag, bisect a change, or compare behavior across environments. When evidence points to a cause, you patch (code change, config change, data fix) and then validate: unit/integration tests, manual verification, performance checks, and monitoring for regression.
Key artifacts you rely on
Most investigations revolve around a small set of concrete items:
- Logs and stack traces to see what happened and where.
- Metrics and traces to understand timing, error rates, and dependency behavior.
- Tests (existing or newly written) to lock the bug in place and prevent repeats.
- Diffs and deploy history to connect failures to recent changes.
Where time usually goes
The slowest parts are usually reproduction and isolation. Getting the same failure reliably—especially when it’s data-dependent or intermittent—often takes longer than writing the fix.
Common constraints
Debugging rarely happens in perfect conditions: deadlines drive quick decisions, engineers context-switch between incidents and feature work, and the available data can be incomplete (missing logs, sampling, short retention). The workflow still works—but it rewards careful note-taking and a bias toward verifiable evidence.
How AI-Assisted Debugging Typically Works
AI-assisted debugging usually looks less like “hand the bug to a bot” and more like adding a fast research partner inside the normal loop. The developer still owns problem framing, experiments, and final confirmation.
A practical loop: ask → test → refine → confirm
You start by feeding the assistant just enough context: the symptom, the failing test or endpoint, relevant logs, and the suspected area of code. Then you iterate:
- Ask: “Given this stack trace and recent diff, what are plausible root causes?”
- Test: Run the smallest experiment that can falsify the top hypothesis (a focused test, a logging tweak, a local repro).
- Refine: Update the prompt with what you learned (“Hypothesis A is wrong because…”). Ask for the next best guess.
- Confirm: Accept a fix only once it passes real checks: unit/integration tests, manual repro, or production-like validation.
Where AI helps most
AI tends to be strongest at speeding up the “thinking and searching” parts:
- Summarizing noisy inputs: turning long logs, traces, or error reports into a short timeline and likely failure point.
- Proposing hypotheses: listing probable causes ranked by evidence (config changes, null handling, race conditions, version mismatches).
- Suggesting code changes: small patches, guard clauses, better error messages, or targeted refactors—often with test updates.
The role of tools around the model
The assistant is more useful when it’s connected to your workflow:
- IDE integration for quick context (open files, diffs, symbol lookups).
- Code search to find related call sites, configs, or similar past issues.
- Test generation to create a minimal repro or regression test you can run immediately.
- Tracing/logging helpers to propose what to instrument and where.
The rule of thumb: treat AI output as a hypothesis generator, not an oracle. Every proposed explanation and patch needs verification through actual execution and observable evidence.
Head-to-Head: Speed, Accuracy, Consistency, Learning
AI-assisted and human-led debugging can both produce great outcomes, but they optimize for different things. The most useful comparison isn’t “which is better,” but where each approach saves time—or adds risk.
Speed
AI tends to win on hypothesis generation. Given an error message, a stack trace, or a failing test, it can quickly propose likely causes, related files, and candidate fixes—often faster than a person can scan a codebase.
The trade-off is validation time. Suggestions still need to be checked against reality: reproduce the bug, confirm assumptions, and verify the fix doesn’t break nearby behavior. If you accept ideas too quickly, you can lose time undoing a confident-but-wrong change.
Accuracy
Humans usually win when accuracy depends on context: business rules, product decisions, and the “why” behind unusual code.
AI can be accurate when it has enough signal (clear errors, good tests, precise logs), but it carries a specific risk: plausible explanations that match common patterns, yet don’t match your system. Treat AI output as a starting point for experiments, not a verdict.
Consistency
Traditional debugging shines when teams rely on repeatable routines: checklists for reproduction, logging, rollback plans, and verification steps. That consistency helps during incidents, handoffs, and postmortems.
AI reasoning quality can vary by prompt and by the context provided. You can improve consistency by standardizing how you ask for help (e.g., always include repro steps, expected vs actual behavior, and the last known-good change).
Learning
Human-led debugging builds deep understanding: mental models of system behavior, intuition about failure patterns, and better design choices next time.
AI can accelerate onboarding by explaining unfamiliar code, suggesting where to look, and summarizing likely causes—especially for newcomers. To keep learning real, ask the AI to explain its reasoning and require yourself to confirm it with tests, logs, or minimal reproductions.
Strengths and Weaknesses by Task Type
AI-assisted and human-led debugging aren’t “better vs worse”—they’re different tools. The fastest teams treat AI like a specialist for certain job shapes, and keep humans in charge where judgment and context matter.
Where AI tends to help most
AI is strongest when the work is text-heavy, repetitive, or benefits from broad recall across many code patterns.
For example, if you paste a noisy stack trace or a long, messy log excerpt, an LLM can quickly:
- Spot repeated error signatures and suspicious timestamps
- Summarize what changed between “working” and “broken” runs
- Suggest likely failure clusters (null handling, config mismatch, race conditions)
It’s also good at generating “next probes” (what to log, what to assert, which edge case to test) when you already have a hypothesis.
Where humans reliably win
Humans outperform AI when debugging depends on system intuition, domain context, and risk judgment.
A model may not understand why a “wrong” value is actually correct per a contract, policy, or business rule. Humans can weigh competing explanations against real-world constraints: what customers expect, what compliance allows, what rollback risk is acceptable, and what trade-offs are strategic.
A simple matching guideline
Use AI for parsing, triage, summarization, and generating candidate hypotheses. Use humans for interpreting requirements, validating impact, choosing safe fixes, and deciding when to stop investigating and ship a patch.
When in doubt, let AI propose possibilities—but require human confirmation before changing behavior in production code.
Failure Modes and How to Reduce Them
AI and humans fail in different ways during debugging. The fastest teams assume failure is normal, then design guardrails so mistakes get caught early—before they ship.
Common AI failure modes
AI-assisted debugging can accelerate triage, but it can also:
- Hallucinate root causes that sound plausible but don’t match the evidence.
- Propose overconfident fixes without acknowledging uncertainty or gaps.
- Smuggle in hidden assumptions (framework version, deployment model, data shape) that don’t hold in your codebase.
Mitigation: treat AI output as hypotheses, not answers. Ask “what evidence would confirm or falsify this?” and run small, cheap checks.
Common human failure modes
Human-led debugging is strong on context and judgment, but people can slip into:
- Tunnel vision (fixating on a favorite suspect).
- Confirmation bias (only noticing evidence that supports the current theory).
- Fatigue-driven mistakes, especially during incidents.
- The classic “works on my machine” trap (environment drift, missing flags, cached state).
Mitigation: externalize your thinking. Write down the hypothesis, the expected observable signal, and the minimal experiment.
Practical mitigations that work for both
Run small experiments. Prefer reversible changes, feature flags, and minimal repros.
Make hypotheses explicit. “If X is true, then Y should change in the logs/metrics/tests.”
Use peer review intentionally. Review not just the code change, but the reasoning chain: evidence → hypothesis → experiment → conclusion.
Add a clear “stop” rule
Decide upfront when to switch approaches or escalate. Examples:
- After 2 failed hypotheses or 30 minutes without new evidence, stop and widen the search.
- If the issue touches security, payments, data loss, or compliance, pause AI assistance and escalate to senior review.
- If the AI keeps changing theories, stop and focus on observability and reproduction before attempting another fix.
Practical Prompting Patterns for Debugging (Without Leaks)
AI assistants are most useful when you treat them like a junior investigator: give them clean evidence, ask for structured thinking, and keep sensitive data out of the room.
Start with high-quality inputs (but keep them minimal)
Before you prompt, assemble a “debug packet” that’s small and specific:
- A minimal reproduction (steps or a tiny snippet) that triggers the issue
- The exact error message and stack trace
- Only the relevant logs (time window + request/trace ID)
- Key environment details (OS, language/runtime version, flags)
The goal is to remove noise without losing the one detail that matters.
Ask for hypotheses + tests (not just a final fix)
Instead of “How do I fix this?”, request a short list of plausible causes and how to prove or disprove each one. This keeps the assistant from guessing and gives you a plan you can execute.
Example prompt:
You are helping me debug a bug. Based on the repro + logs below:
1) List 3–5 hypotheses (ranked).
2) For each, propose a quick test/observation that would confirm it.
3) Suggest the smallest safe change if the top hypothesis is confirmed.

Repro:
...
Error:
...
Logs:
...
Environment:
...
Require citations to specific locations and observed outputs
When the assistant proposes a change, ask it to point to concrete evidence: filenames, functions, config keys, or log lines that support the reasoning. If it can’t cite anything, treat the suggestion as an idea to verify, not an answer.
Keep prompts sanitized (no secrets, no customer data)
Remove API keys, tokens, passwords, private URLs, and personal/customer information. Prefer placeholders like API_KEY=REDACTED and trimmed samples. If you must share data patterns, share structure (field names, sizes, formats) rather than real values.
If your org has rules here, link them in your internal docs and enforce them in code review—not just in prompts.
Tooling and Observability: Where Each Approach Shines
Debugging quality depends less on “how smart” the debugger is and more on what evidence you can reliably gather. Traditional workflows excel when teams have strong observability habits; AI-assisted workflows excel when they reduce the friction of getting to the right evidence quickly.
The core toolkit (and what it’s good for)
A human-led approach leans on well-known tools:
- Debugger: best for stepping through code paths and confirming what actually executes.
- Profiler: best for performance issues (slow endpoints, high CPU, memory growth).
- Tracing: best for distributed systems where the bug crosses service boundaries.
- Log search: best for pattern spotting, correlation, and “what happened around time X?”.
- Feature flags: best for isolating impact, rolling back safely, and testing hypotheses in production-like conditions.
Humans are strong at choosing which tool fits the situation and noticing when data “smells wrong” (missing spans, misleading logs, sampling gaps).
How AI complements observability work
AI can speed up the mechanical parts without replacing judgment:
- Draft log and trace queries from a short description (“errors spike after deploy, only EU region”).
- Generate checklists for common incident types (timeouts, rate limits, cache stampedes).
- Summarize runbooks and past incident notes into a focused plan (“verify X, then Y, then collect Z”).
The key is to treat AI output as a proposal, then validate it against real telemetry.
If your team wants this kind of assistance embedded in the build-and-ship loop (not just in an external chat), a vibe-coding platform like Koder.ai can be useful: you can iterate in chat, keep changes small, and rely on practical guardrails such as planning mode (to align on intent before edits) and snapshots/rollback (to undo bad experiments quickly). This complements debugging best practices because it nudges you toward reversible, testable changes instead of “big bang” fixes.
Keep one source of truth: evidence, not opinions
Whether you’re using AI or not, align the team on a single source of truth: observed telemetry and test results. A practical tactic is a standard incident “evidence pack” attached to the ticket:
- timeframe, release/version, feature flag state
- top logs/traces (queries included), key charts/screenshots
- reproduction steps and failing test (if any)
- leading hypothesis + what data supports/contradicts it
AI can help assemble the pack, but the pack itself keeps the investigation grounded.
Quality and Metrics: How to Evaluate Debugging Performance
“Did we fix it?” is a start. “Did we fix the right thing, safely, and repeatably?” is the real question—especially when AI tools can increase output without guaranteeing correctness.
Define outcomes you can measure
Pick a small set of metrics that reflect the debugging lifecycle end to end:
- Time to reproduce (TTR): how long from report to a reliable repro.
- Time to fix (TTF): how long from repro to a merged change.
- Regression rate: how often related failures reappear (or new ones appear) after the change.
When comparing AI-assisted vs human-led workflows, measure these per class of issue (UI bug vs race condition vs config drift). AI often helps with faster TTR/TTF on well-scoped problems, while humans may outperform on messy, multi-service root causes.
Track the “false fix” rate
A key metric for AI-assisted debugging is false fixes: patches that silence symptoms (or satisfy a narrow test) but don’t address the root cause.
Operationalize it as: % of fixes that require follow-up because the original issue persists, reoccurs quickly, or shifts elsewhere. Pair it with “reopen rate” from your tracker and “rollback rate” from deployments.
Build quality checks into the definition of done
Speed only matters if quality holds. Require evidence, not confidence:
- Unit + integration tests updated to capture the repro and prevent recurrence
- Canary releases (or staged rollouts) with clear success metrics
- Postmortems for high-severity incidents, focusing on contributing factors and detection gaps
Use team metrics carefully
Avoid incentives that reward risky speed (e.g., “tickets closed”). Prefer balanced scorecards: TTF plus regression/rollback, plus a lightweight review of root-cause clarity. If AI helps ship faster but raises false-fix or regression rates, you’re borrowing time from future outages.
Security, Privacy, and Compliance Considerations
AI can speed up debugging, but it also changes your data handling risk profile. Traditional debugging usually keeps code, logs, and incidents inside your existing toolchain. With an AI assistant—especially a cloud-hosted one—you’re potentially moving snippets of source code and production telemetry to another system, which may be unacceptable under company policy or customer contracts.
What you can (and shouldn’t) share
A practical rule: assume anything you paste into an assistant could be stored, reviewed for safety, or used for service improvement unless you have an explicit agreement stating otherwise.
Share only what’s necessary to reproduce the issue:
- Minimal code excerpts (small functions, failing tests, simplified configs)
- Sanitized stack traces and error messages
- Synthetic inputs that mimic the bug without exposing real customer data
Avoid sharing:
- API keys, tokens, cookies, private certificates
- Customer PII (names, emails, addresses), payment data, health data
- Full production logs/dumps when a few relevant lines will do
- Proprietary algorithms or “entire repo” context unless approved
Prefer approved environments (or on-device)
If your policy requires strict control, choose an on-device model or an enterprise/approved environment that guarantees:
- No training on your inputs by default
- Data residency and retention controls
- Audit logs and access controls aligned with your compliance needs
When in doubt, treat AI as another third-party vendor and route it through the same approval process your security team uses for new tools. If you need guidance on internal standards, see /security.
If you’re evaluating platforms, include operational details in your review: where the system runs, how data is handled, and what deployment controls exist. For example, Koder.ai runs on AWS globally and supports deploying apps in different regions to help meet data residency and cross-border transfer requirements—useful when debugging touches production telemetry and compliance constraints.
Redaction and safe summarization patterns
When debugging with AI, redact aggressively and summarize precisely:
- Replace identifiers:
customer_id=12345→customer_id=<ID> - Mask secrets:
Authorization: Bearer …→Authorization: Bearer <TOKEN> - Convert raw logs to a short narrative: “Service A times out after 30s when calling Service B; retries increase load; happens only in region X.”
If you must share data shapes, share schemas rather than records (e.g., “JSON has fields A/B/C, where B can be null”). Synthetic examples often get you most of the value with near-zero privacy exposure.
Compliance: align with your obligations
Regulated teams (SOC 2, ISO 27001, HIPAA, PCI) should document:
- What data is permitted in prompts
- Which assistants/models are approved
- How prompts and outputs are logged, retained, and reviewed
Keep humans responsible for final decisions: treat AI output as a suggestion, not an authoritative diagnosis—especially when the fix touches authentication, data access, or incident response.
Team Adoption: Rolling Out AI Help Without Losing Rigor
Rolling out AI-assisted debugging works best when you treat it like any other engineering tool: start small, set expectations, and keep a clear path from “AI suggestion” to “verified fix.” The goal isn’t to replace disciplined debugging—it’s to reduce time spent on dead ends while keeping evidence-based decisions.
Start with a pilot, not a mandate
Pick 1–2 low-risk, high-frequency use cases for a short pilot (two to four weeks). Good starting points include log interpretation, generating test ideas, or summarizing reproduction steps from issue reports.
Define guidelines and review gates up front:
- Where it’s allowed: internal services, non-sensitive repos, known-safe datasets.
- What must be shown in review: repro steps, the confirming signal (test/log/trace), and why the change addresses the root cause.
- What is not acceptable: “The model said so” as justification.
Train the team on evidence gathering, not clever prompts
Provide prompt templates that force discipline: ask for hypotheses, what evidence would confirm/refute each, and the next minimal experiment.
Keep a small internal library of “good debugging conversations” (sanitized) that demonstrate:
- Asking the assistant to use only provided logs/code excerpts
- Requesting two competing hypotheses
- Turning suggestions into concrete checks (a test, a breakpoint plan, a query)
If you already have contribution docs, link the templates from /docs/engineering/debugging.
Clarify role changes so quality doesn’t drift
AI can help juniors move faster, but guardrails matter:
- Senior engineers validate root-cause claims and insist on measurable confirmation.
- Juniors use AI to explore options, but must attach evidence to each step (tests, traces, diffs).
Build a shared playbook—and update it from real incidents
After each incident or tricky bug, capture what worked: prompts, checks, failure signals, and the “gotchas” that fooled the assistant. Treat the playbook as living documentation, reviewed like code, so your process improves with every real debugging story.
A Hybrid Workflow You Can Use Today
A practical middle ground is to treat an LLM like a fast debugging partner for generating possibilities—and treat humans as the final authority for verification, risk, and release decisions. The goal is breadth first, then proof.
The loop: explore with AI, validate like a skeptic
-
Reproduce and freeze the facts (human-led). Capture the exact error, steps to reproduce, affected versions, and recent changes. If you can’t reproduce, don’t ask the model to guess—ask it to help design a reproduction plan.
-
Ask AI for hypotheses (AI-assisted). Provide minimal, sanitized context: symptoms, logs (redacted), environment, and what you already tried. Ask for ranked root-cause hypotheses and the smallest test to confirm or reject each.
-
Run verification loops (human-led). Execute one test at a time, record results, and update the model with outcomes. This keeps the AI grounded and prevents “storytelling” from replacing evidence.
-
Draft the fix with AI, review like production code (human-led). Let AI propose patch options and tests, but require human approval for correctness, security, performance, and backward compatibility.
-
Close the loop with learning (shared). Ask AI to summarize: root cause, why it was missed, and a prevention step (test, alert, runbook update, or guardrail).
If you’re doing this inside a chat-driven build environment like Koder.ai, the same loop applies—just with less friction between “idea” and “testable change.” In particular, snapshots and rollback support make it easier to try an experiment, validate it, and revert cleanly if it’s a false lead.
Copy/paste: an AI-assisted checklist
- Repro steps + expected vs actual behavior captured
- Logs/configs sanitized; secrets removed
- 3–5 hypotheses ranked with one validation test each
- Smallest change that fixes the issue proposed
- Tests added/updated; regression risk assessed
- Postmortem note: prevention action recorded
If you want a longer version, see /blog/debugging-checklist. If you’re evaluating team-wide tooling and controls (including enterprise governance), /pricing may help you compare options.
FAQ
What’s the difference between AI-assisted debugging and human-led debugging?
AI-assisted debugging uses an LLM to speed up parts of the workflow (summarizing logs, proposing hypotheses, drafting patches), while a human still frames the problem and validates outcomes. Human-led debugging relies primarily on manual reasoning and evidence gathering with standard tools (debugger, tracing, metrics) and emphasizes accountability through reproducible proof.
When should I use AI help vs relying on traditional debugging?
Use AI when you need to quickly:
- Interpret stack traces and noisy logs
- Generate and rank plausible root-cause hypotheses
- Draft small patch options and regression tests
Prefer human-led work when decisions depend on domain rules, risk trade-offs, or production constraints (security, payments, compliance), and when you must ensure the fix is correct beyond “it seems plausible.”
What is a practical AI-assisted debugging workflow I can adopt today?
A typical loop is:
- Share a minimal, sanitized “debug packet” (repro, exact error, relevant logs, environment).
- Ask for 3–5 ranked hypotheses plus a quick test for each.
- Run the smallest falsifying experiment.
- Feed results back and iterate.
- Accept changes only after tests and real-world checks pass.
Treat the model as a hypothesis generator—not an authority.
What context should I include in prompts to get useful debugging help?
Provide:
- Minimal reproduction steps (or failing test)
- Exact error message + stack trace
- A small, time-bounded log excerpt tied to a request/trace ID
- Environment details (runtime/framework versions, flags)
- Recent relevant diffs/deploy info
Avoid pasting whole repos or entire production log dumps—start small and expand only if needed.
Can AI confidently suggest the wrong fix, and how do I prevent that?
Yes. Common failure modes include:
- Hallucinated root causes that don’t match the evidence
- Overconfident recommendations without uncertainty
- Hidden assumptions (versions, deployment model, data shape)
Mitigate by asking: “What evidence would confirm or falsify this?” and running cheap, reversible tests before making broad changes.
Why do reproduction and isolation take the most time in debugging?
Reproduction and isolation often dominate time because intermittent or data-dependent issues are hard to trigger on demand. If you can’t reproduce reliably:
- Ask AI to propose a reproduction plan (instrumentation, inputs to replay, env parity checks)
- Tighten observability (trace IDs, better logs, metrics)
- Create a minimal failing test to “freeze” the bug
Once you can reproduce, fixes become much faster and safer.
How can AI complement observability tools like logs, traces, and metrics?
AI can draft helpful proposals, such as:
- Log/trace query sketches from a symptom description
- Instrumentation suggestions (where to add logs, what fields to include)
- Checklists for common incident patterns (timeouts, retries, cache issues)
- Summaries of incident timelines from raw logs
You still validate against real telemetry—observed outputs remain the source of truth.
What metrics should teams use to evaluate AI-assisted debugging performance?
Track end-to-end outcomes, not just speed:
- Time to reproduce (TTR)
- Time to fix (TTF)
- Regression/reopen rate
- Rollback rate
- “False fix” rate (symptom reduced but root cause persists)
Compare by issue type (UI bug vs config drift vs race condition) to avoid misleading averages.
How do I use AI for debugging without leaking secrets or customer data?
Don’t share secrets or sensitive data. Practical rules:
- Redact tokens, API keys, cookies, certificates, private URLs
- Remove customer PII and regulated data (payments, health)
- Prefer schemas and synthetic examples over real records
- Share the smallest code/log excerpt needed to reproduce
If you need internal guidance, use relative links like /security or your internal docs.
How can a team adopt AI-assisted debugging without losing rigor?
A good rollout is structured:
- Pilot 2–4 weeks on low-risk, high-frequency tasks (log interpretation, test ideas)
- Standardize a prompt template that asks for hypotheses + falsifiable tests
- Require evidence in code review (repro steps, confirming signal, why it fixes root cause)
- Define a stop/escalation rule (e.g., after 2 failed hypotheses or if the issue touches security/payments)
The key standard: “The model said so” is never sufficient justification.