Nov 30, 2025·8 min
How to Build a Web App for Cloud Cost and Usage Allocation
Learn how to design and build a web app that ingests cloud billing data, allocates usage to teams, and delivers dashboards, budgets, and actionable reports.
Learn how to design and build a web app that ingests cloud billing data, allocates usage to teams, and delivers dashboards, budgets, and actionable reports.
Before you build screens or pipelines, get specific about the questions your app must answer. “Cloud costs” can mean an invoice total, a team’s monthly spend, a single service’s unit economics, or the cost of a customer-facing feature. If you don’t define the problem up front, you’ll end up with dashboards that look impressive but don’t resolve disputes.
A helpful framing: your first deliverable isn’t “a dashboard,” it’s a shared definition of truth (what numbers mean, how they’re computed, and who is accountable for acting on them).
Start by naming the primary users and what they need to decide:
Different users require different levels of detail. Finance may want stable, auditable monthly numbers; engineers may want daily granularity and drill-down.
Be explicit about which of these you’re delivering first:
A practical way to keep scope tight is to choose one “primary outcome” and treat the others as follow-ons. Most teams start with showback plus basic anomaly detection, then graduate to chargeback.
List the clouds and billing entities you must support on day one: AWS payer accounts, Azure subscriptions and management groups, GCP billing accounts/projects, plus shared services (logging, networking, security). Decide whether you’ll include marketplace charges and third-party SaaS.
Pick a target update cadence: daily is enough for finance and most teams; near-real-time helps incident response and fast-moving orgs but raises complexity and cost. Also set retention (e.g., 13–24 months) and whether you need immutable “month close” snapshots for audits.
Before you ingest a single CSV or call a billing API, decide what “the truth” looks like in your app. A clear measurement model prevents endless debates later (“Why doesn’t this match the invoice?”) and makes multi-cloud reporting predictable.
At minimum, treat each billing line as a record with a consistent set of measures:
A practical rule: if a value can change what finance pays or what a team gets charged, it deserves its own metric.
Dimensions make costs explorable and allocatable. Common ones:
Keep dimensions flexible: you’ll add more later (e.g., “cluster”, “namespace”, “vendor”).
You usually need multiple time concepts:
Write down a strict definition:
This single definition will shape your dashboards, alerts, and trust in the numbers.
Billing ingestion is the foundation of a cloud cost management app: if the raw inputs are incomplete or hard to reproduce, every dashboard and allocation rule becomes an argument.
Start by supporting the “native truth” for each cloud:
Design each connector to produce the same core outputs: a set of raw files/rows, plus an ingestion log (what you fetched, when, and how many records).
You’ll usually pick one of two patterns:
Many teams run a hybrid: push for freshness, plus a daily pull “sweeper” for missed files.
Ingestion should preserve the original currency, time zone, and billing period semantics. Don’t “fix” anything yet—just capture what the provider says, and store the provider’s period start/end so late adjustments land in the right month.
Store the raw exports in an immutable, versioned staging bucket/container/dataset. This gives you auditability, supports reprocessing when you change parsing logic, and makes disputes solvable: you can point to the exact source file that generated a number.
If you ingest AWS CUR, Azure Cost Management exports, and GCP Billing data as-is, your app will feel inconsistent: the same thing is called a “service” in one file, a “meter” in another, and a “SKU” somewhere else. Normalization is where you turn those provider-specific terms into one predictable schema so every chart, filter, and allocation rule behaves the same.
Start by mapping provider fields into a common set of dimensions you can rely on everywhere:
Keep provider-native IDs too (like AWS ProductCode or GCP SKU ID) so you can trace back to the original record when a user disputes a number.
Normalization isn’t just renaming columns—it’s data hygiene.
Handle missing or malformed tags by separating “unknown” from “unallocated” so you don’t hide problems. Deduplicate rows using a stable key (source line item ID + date + cost) to avoid double-counting from retries. Watch for partial days (especially near “today” or during export delays) and mark them as provisional so dashboards don’t swing unexpectedly.
Every normalized row should carry lineage metadata: source file/export, import time, and a transformation version (e.g., norm_v3). When mapping rules change, you can reprocess confidently and explain differences.
Build automated checks: totals by day, negative-cost rules, currency consistency, and “cost by account/subscription/project.” Then publish an import summary in the UI: rows ingested, rows rejected, time coverage, and the delta vs. provider totals. Trust grows when users can see what happened, not just the final number.
Cost data is only useful when someone can answer “who owns this?” consistently. Tagging (AWS), labels (GCP), and resource tags (Azure) are the simplest way to connect spend to teams, apps, and environments—but only if you treat them like product data, not a best-effort habit.
Start by publishing a small set of required keys that your allocation engine and dashboards will rely on:
teamappcost-centerenv (prod/stage/dev)Make the rules explicit: which resources must be tagged, which tag formats are accepted (e.g., lowercase kebab-case), and what happens when a tag is missing (e.g., “Unassigned” bucket plus an alert). Keep this policy visible inside the app and link to deeper guidance like /blog/tagging-best-practices.
Even with policies, you’ll see drift: TeamA, team-a, team_a, or a renamed team. Add a lightweight “mapping” layer so finance and platform owners can normalize values without rewriting history:
TeamA, team-a → team-a)This mapping UI is also where you can enrich tags: if app=checkout is present but cost-center is missing, you can infer it from an app registry.
Some costs won’t tag cleanly:
Model these as owned “shared services” with clear allocation rules (e.g., split by headcount, usage metrics, or proportional spend). The goal is not perfect attribution—it’s consistent ownership so every dollar has a home and a person who can explain it.
An allocation engine turns normalized billing lines into “who owns this cost, and why.” The goal isn’t just math—it’s producing results that stakeholders can understand, challenge, and improve.
Most teams need a mix of approaches because not all costs arrive with clean ownership:
Model allocation as ordered rules with priority and effective dates. This lets you answer: “What rule was applied on March 10th?” and safely update policy without rewriting history.
A practical rule schema often includes:
Shared costs—Kubernetes clusters, networking, data platforms—rarely map 1:1 to a single team. Treat them as “pools” first, then distribute.
Examples:
Provide before/after views: original vendor line items vs. allocated results by owner. For each allocated row, store an “explanation” (rule ID, match fields, driver values, split percentages). This audit trail reduces disputes and builds trust—especially during chargeback and showback.
Cloud billing exports get big quickly: line items per resource, per hour, across multiple accounts and providers. If your app feels slow, users will stop trusting it—so storage design is product design.
A common setup is a relational warehouse for truth and simple joins (Postgres for smaller deployments; BigQuery or Snowflake when volumes climb), plus OLAP-style views/materializations for analytics.
Store raw billing line items exactly as received (plus a few ingestion fields like import time and source file). Then build curated tables for your app to query. This keeps “what we got” separate from “how we report it,” which makes audits and reprocessing safer.
If you’re building this from scratch, consider accelerating the first iteration with a platform that can scaffold the architecture quickly. For example, Koder.ai (a vibe-coding platform) can help teams generate a working web app via chat—commonly with a React frontend, a Go backend, and PostgreSQL—so you can spend more time validating the data model and allocation logic (the parts that determine trust) instead of re-laying boilerplate.
Most queries filter by time and by boundary (cloud account/subscription/project). Partition and cluster/index accordingly:
This lets “last 30 days for Team A” stay fast even when total history is huge.
Dashboards shouldn’t scan raw line items. Create aggregated tables at the grains users explore:
Materialize these tables on a schedule (or incrementally) so charts load in seconds.
Allocation rules, tagging mappings, and ownership definitions will change. Design for recomputing history:
That flexibility is what turns a cost dashboard into a system people can rely on.
A cost allocation app succeeds when people can answer common questions in seconds: “Why did spend jump?”, “Who owns this cost?”, and “What can we do about it?” Your UI should tell a clear story from totals to details, without forcing users to understand billing jargon.
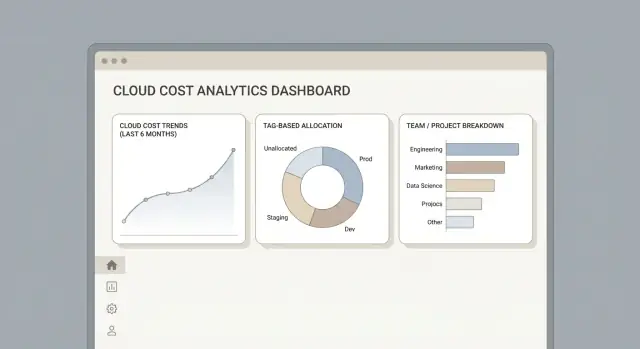
Start with a small set of predictable views:
Use the same filter bar everywhere: date range, cloud, team, project, and environment (prod/stage/dev). Keep filter behavior consistent (same defaults, same “applies to all charts”), and make active filters visible so screenshots and shared links are self-explanatory.
Design an intentional path:
Invoice total → allocated total → service/category → account/project → SKU/line items.
At each step, show the “why” next to the number: applied allocation rules, tags used, and any assumptions. When users land on a line item, provide quick actions like “view owner mapping” (link to /settings/ownership) or “report missing tags” (link to /governance/tagging).
Add CSV exports from every table, but also support shareable links that preserve filters. Treat links like reports: they should honor role-based access, include an audit trail, and optionally expire. This makes collaboration easy while keeping sensitive spend data controlled.
Dashboards explain what happened. Budgets and alerts change what happens next.
If your app can’t tell a team “you’re about to blow your monthly budget” (and notify the right person), it stays a reporting tool—not an operational one.
Start with budgets at the same level you allocate costs: team, project, environment, or product. Each budget should have:
Keep the UI simple: one screen to set amount + scope + owner, and a preview of “last month spend in this scope” to sanity-check.
Budgets catch slow drift, but teams also need immediate signals:
Make alerts actionable: include top drivers (service, region, project), a short explanation, and a link into your explorer view (e.g., /costs?scope=team-a&window=7d).
Before machine learning, implement baseline comparisons that are easy to debug:
This avoids noisy alerts on tiny spend categories.
Store every alert event with status: acknowledged, muted, false positive, fixed, or expected. Track who acted and how long it took.
Over time, use that history to reduce noise: auto-suppress repeat alerts, improve thresholds per scope, and identify “always untagged” teams that need workflow fixes rather than more notifications.
Cost data is sensitive: it can reveal vendor pricing, internal projects, and even customer commitments. Treat your cost app like a financial system—because for many teams, it effectively is.
Start with a small set of roles and make them easy to understand:
Enforce these in the API (not just the UI), and add resource-level scoping (e.g., a team lead can’t see other teams’ projects).
Cloud billing exports and usage APIs require credentials. Store secrets in a dedicated secret manager (or encrypted at rest with KMS), never in plain database fields. Support safe rotation by allowing multiple active credentials per connector with an “effective date,” so ingestion doesn’t break during key swaps.
Practical UI details help: show the last successful sync time, permission scope warnings, and a clear “re-authenticate” flow.
Add append-only audit logs for:
Make logs searchable and exportable (CSV/JSON) and link each log entry to the affected object.
Document retention and privacy settings in the UI: how long raw billing files are kept, when aggregated tables replace raw data, and who can delete data. A simple “Data Handling” page (e.g., /settings/data-handling) reduces support tickets and builds confidence with finance and security teams.
A cost allocation app only changes behavior when it shows up where people already work. Integrations reduce “reporting overhead” and turn cost data into shared, operational context—finance, engineering, and leadership all see the same numbers in their daily tools.
Start with notifications because they drive immediate action. Send concise messages with the owner, the service, the delta, and a link back to the exact view in your app (filtered to the team/project and time window).
Typical alerts:
If access is hard, people won’t adopt. Support SAML/OIDC SSO and map identity groups to cost “owners” (teams, cost centers). This also simplifies offboarding and keeps permissions aligned with org changes.
Provide a stable API so internal systems can fetch “cost by team/project” without screen-scraping dashboards.
A practical shape:
GET /api/v1/costs?team=payments&start=2025-12-01&end=2025-12-31&granularity=dayDocument rate limits, caching headers, and idempotent query semantics so consumers can build reliable pipelines.
Webhooks make your app reactive. Fire events like budget.exceeded, import.failed, anomaly.detected, and tags.missing to trigger workflows in other systems.
Common destinations include Jira/ServiceNow ticket creation, incident tools, or custom runbooks.
Some teams insist on their own dashboards. Offer a governed export (or a read-only warehouse schema) so BI reports use the same allocation logic—not reimplemented formulas.
If you package integrations as add-ons, link users to /pricing for plan details.
A cost allocation app only works if people believe it. That trust is earned through repeatable testing, visible data quality checks, and a rollout that lets teams compare your numbers to what they already know.
Start by building a small library of provider exports and invoices that represent common edge cases: credits, refunds, taxes/VAT, reseller fees, free tiers, committed-use discounts, and support charges. Keep versions of these samples so you can re-run tests whenever you change parsing or allocation logic.
Focus tests on outcomes, not just parsing:
Add automated checks that reconcile your computed totals to provider-reported totals within a tolerance (for example, due to rounding or timing differences). Track these checks over time and store the results so you can answer, “When did this drift start?”
Helpful assertions:
Set up alerts for ingestion failures, stalled pipelines, and “data not updated since” thresholds. Monitor slow queries and dashboard load times, and log which reports drive heavy scans so you can optimize the right tables.
Run a pilot with a few teams first. Give them a comparison view against their existing spreadsheets, agree on definitions, then roll out broadly with short training and a clear feedback channel. Publish a change log (even a simple /blog/changelog) so stakeholders see what changed and why.
If you’re iterating quickly on product requirements during the pilot, tools like Koder.ai can be useful to prototype UI flows (filters, drill-down paths, allocation rule editors) and regenerate working versions as definitions evolve—while still keeping you in control of source code export, deployment, and rollback as the app matures.
Start by defining the exact decisions the app must support (variance explanation, waste reduction, budget accountability, forecasting). Then align on primary users (Finance/FinOps, Engineering, team leads, executives) and the minimum outcomes you’ll deliver first: showback, chargeback, forecasting, or budget control.
Avoid building dashboards before you’ve written down what “good” looks like and how you’ll reconcile to provider invoices.
Showback provides visibility (who is spending what) without issuing internal invoices. Chargeback creates enforceable internal billing where allocations “hit” budgets and often require approvals and audit trails.
If you need strong accountability, start designing for chargeback early (immutable month-close snapshots, explainable rules, and formal exports), even if you launch with showback UI first.
Model each provider line item as a record with consistent measures:
A practical rule is: if it can change what finance pays or what a team gets charged, make it a first-class metric.
Start with dimensions that users actually “group by”:
Keep dimensions flexible so you can add cluster/namespace/vendor later without breaking reports.
Capture multiple time keys because different workflows depend on different clocks:
Also store the provider’s original time zone and billing boundaries so late adjustments land where the provider intends.
Near-real-time helps incident response and fast-moving organizations, but increases complexity (deduplication, partial-day handling) and cost.
Daily updates are usually enough for finance and most teams. A common hybrid is event-driven ingestion for freshness plus a daily scheduled “sweeper” job to catch missed files.
Keep an immutable, versioned staging area for raw provider exports (S3/Blob/BigQuery tables) and store an ingestion log (what was fetched, when, record counts).
This enables audits, reproducible reprocessing after parser changes, and faster dispute resolution because you can point to the exact source file that produced a number.
Normalize provider-specific concepts into a unified schema (for example: Service, SKU, Usage Type), while preserving provider-native IDs for traceability.
Then apply hygiene steps:
This makes multi-cloud charts and allocation rules behave predictably.
Define a small set of required keys (for example team, app, cost-center, env) with allowed formats and clear consequences for missing tags.
Add a mapping layer in the product to handle real-world drift (e.g., TeamA → team-a), support time-bound mappings, and keep an audit trail of who changed what and why.
Treat allocation as ordered rules with priority and effective dates. Support multiple methods:
Make results explainable by storing the “why” per allocated row (rule ID, match fields, driver values, split percent) and providing before/after views from vendor line items to allocated outputs.