

How to Build a Web App to Track Feature Adoption & Behavior
A practical guide to building a web app that tracks feature adoption and user behavior, from event design to dashboards, privacy, and rollout.
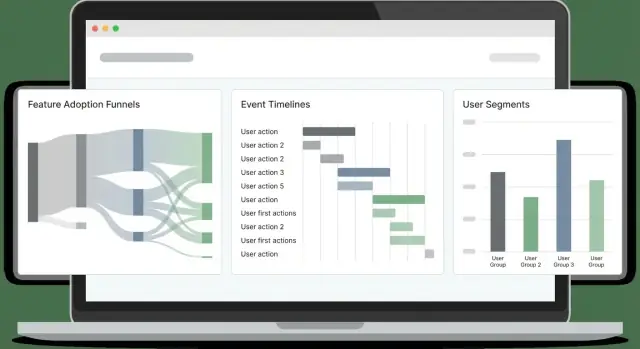
Define Goals, Questions, and Success Metrics
Before you track anything, decide what “feature adoption” actually means for your product. If you skip this step, you’ll collect plenty of data—and still argue in meetings about what it “means.”
Define “adoption” in plain terms
Adoption usually isn’t a single moment. Pick one or more definitions that match how value is delivered:
- Use: a user tries the feature at least once (good for new launches).
- Repeat use: the user uses it again within a time window (good for habit-forming workflows).
- Value achieved: the user reaches an outcome the feature is meant to enable (often the best signal).
Example: for “Saved Searches,” adoption might be created a saved search (use), ran it 3+ times in 14 days (repeat), and received an alert and clicked through (value achieved).
List the decisions your tracking should support
Your tracking should answer questions that lead to action, such as:
- What should we improve because it’s used but fails to deliver value?
- What should we retire because it adds complexity with low adoption?
- What should we promote because it drives retention or upgrades?
Write these as decision statements (e.g., “If activation drops after release X, we roll back onboarding changes.”).
Identify stakeholders and how they’ll use reports
Different teams need different views:
- Product (PM): adoption by segment, post-release impact, value milestones.
- Growth/Marketing: campaign lift, conversion funnels, re-engagement.
- Support/Success: which features correlate with fewer tickets or higher renewals.
- Engineering: instrumentation health, event volume changes, release markers.
Set success metrics and cadence
Choose a small set of metrics to review weekly, plus a lightweight release check after every deployment. Define thresholds (e.g., “Adoption rate ≥ 25% among active users in 30 days”) so reporting drives decisions, not debate.
Map the Data You Need: Users, Features, Events, Outcomes
Before you instrument anything, decide what “things” your analytics system will describe. If you get these entities right, your reports stay understandable even as the product evolves.
Start with the core entities
Define each entity in plain language, then translate it into IDs you can store:
- User: a person using the app (may start anonymous, later authenticated).
- Account / workspace: the paying customer or team container that multiple users belong to.
- Session: a time-bounded visit (useful for engagement and troubleshooting; optional for some products).
- Feature: a named capability you want to measure adoption for (often a group of events, not a single click).
- Event: an action or system occurrence you can record (e.g.,
project_created,invite_sent). - Outcome: the value milestone you want users/accounts to reach (e.g., “first report shared,” “subscription activated”).
Write down the minimum properties you need for each event: user_id (or anonymous ID), account_id, timestamp, and a few relevant attributes (plan, role, device, feature flag, etc.). Avoid dumping everything “just in case.”
Choose the adoption views you’ll support
Pick the reporting angles that match your product goals:
- Funnels (step-by-step activation)
- Cohorts (groups by signup date, plan, channel)
- Retention (do they come back and repeat key actions?)
- Paths (common sequences before/after a milestone)
- Time-to-first-value (how long until the first meaningful outcome)
Your event design should make these computations straightforward.
Decide platforms and performance targets
Be explicit about scope: web only first, or web + mobile from day one. Cross-platform tracking is easiest if you standardize event names and properties early.
Finally, set non-negotiable targets: acceptable page performance impact, ingestion latency (how fresh dashboards must be), and dashboard load time. These constraints guide later choices in tracking, storage, and querying.
Design an Event Tracking Schema That Stays Consistent
A good tracking schema is less about “tracking everything” and more about making events predictable. If event names and properties drift, dashboards break, analysts stop trusting data, and engineers hesitate to instrument new features.
Start with a clear naming convention
Pick a simple, repeatable pattern and stick to it. A common choice is verb_noun:
viewed_pricing_pagestarted_trialenabled_featureexported_report
Use past tense consistently (or present tense consistently), and avoid synonyms (clicked, pressed, tapped) unless they truly mean different things.
Define required properties (the “contract”)
Every event should carry a small set of required properties so you can segment, filter, and join reliably later. At minimum, define:
user_id(nullable for anonymous users, but present when known)account_id(if your product is B2B/multi-seat)timestamp(server-generated when possible)feature_key(stable identifier like"bulk_upload")plan(e.g.,free,pro,enterprise)
These properties make feature adoption tracking and user behavior analytics far easier because you don’t have to guess what’s missing in each event.
Allow optional properties—carefully
Optional fields add context, but they’re easy to overdo. Typical optional properties include:
device,os,browserpage,referrerexperiment_variant(orab_variant)
Keep optional properties consistent across events (same key names, same value formats), and document any “allowed values” where possible.
Version your schema and write an instrumentation spec
Assume your schema will evolve. Add an event_version (e.g., 1, 2) and update it when you change meaning or required fields.
Finally, write an instrumentation spec that lists each event, when it fires, required/optional properties, and examples. Keep that doc in source control alongside your app so schema changes are reviewed like code.
Solve Identity: Anonymous, Logged-In, and Account-Level Views
If your identity model is shaky, your adoption metrics will be noisy: funnels won’t line up, retention will look worse than it is, and “active users” will be inflated by duplicates. The goal is to support three views at once: anonymous visitors, logged-in users, and account/workspace activity.
Anonymous vs. identified users (and when to link)
Start every device/session with an anonymous_id (cookie/localStorage). The moment a user authenticates, link that anonymous history to an identified user_id.
Link identities when the user has proven ownership of the account (successful login, magic link verification, SSO). Avoid linking on weak signals (email typed into a form) unless you clearly separate it as “pre-auth.”
Login, logout, and account switching without breaking metrics
Treat auth transitions as events:
login_success(includesuser_id,account_id, and the currentanonymous_id)logoutaccount_switched(fromaccount_id→account_id)
Important: don’t change the anonymous cookie on logout. If you rotate it, you’ll fragment sessions and inflate unique users. Instead, keep the stable anonymous_id, but stop attaching user_id after logout.
Identity merge rules (and avoiding double counting)
Define merge rules explicitly:
- User merge: prefer a stable internal
user_id. If you must merge by email, do it server-side and only for verified emails. Keep an audit trail. - Account merge: use a stable
account_id/workspace_idgenerated by your system, not a mutable name.
When merging, write a mapping table (old → new) and apply it consistently at query time or via a backfill job. This prevents “two users” showing up in cohorts.
Store stable keys
Store and send:
anonymous_id(stable per browser/device)user_id(stable per person)account_id(stable per workspace)
With those three keys, you can measure behavior pre-login, per-user adoption, and account-level adoption without double counting.
Choose Client-Side vs Server-Side Tracking (and Mix Them)
Where you track events changes what you can trust. Browser events tell you what people attempted to do; server events tell you what actually happened.
Client-side tracking (browser)
Use client-side tracking for UI interactions and context you only have in the browser. Typical examples:
- Page/screen views, button clicks, tab switches, open/close of modals
- “Viewed feature” moments (e.g., settings page opened)
- Client context: URL, referrer, UTM tags, device type, viewport size, language
Batch events to reduce network chatter: queue in memory, flush every N seconds or at N events, and also flush on visibilitychange/page hide.
Server-side tracking (APIs and jobs)
Use server-side tracking for any event that represents a completed outcome or a billing/security-sensitive action:
- Feature enabled/disabled saved successfully
- Invitation accepted, payment succeeded, export generated
- Background jobs: sync finished, report delivered, email sent
Server-side tracking is usually more accurate because it isn’t blocked by ad blockers, page reloads, or flaky connectivity.
Recommended approach: hybrid by default
A practical pattern is: track intent in the client and success on the server.
For example, emit feature_x_clicked_enable (client) and feature_x_enabled (server). Then enrich server events with client context by passing a lightweight context_id (or request ID) from the browser to the API.
Reliability: retries, backoff, offline buffering
Add resiliency where events are most likely to drop:
- Client: persist a small queue in
localStorage/IndexedDB, retry with exponential backoff, cap retries, and dedupe byevent_id. - Server: retry on transient failures, use an internal queue, and ensure idempotency so a retry doesn’t double-count.
This mix gives you rich behavioral detail without sacrificing trustworthy adoption metrics.
Plan the System Architecture: Ingestion, Storage, and Query
A feature-adoption analytics app is mainly a pipeline: capture events reliably, store them cheaply, and query them fast enough that people trust and use the results.
Core components (and why they matter)
Start with a simple, separable set of services:
- Collector endpoint: a small HTTP service that receives events (from browser, mobile, backend). Keep it fast and minimal—validate basics, add server timestamps, and return quickly.
- Queue/stream: buffers traffic spikes and decouples ingestion from processing (Kafka, Kinesis, Pub/Sub, SQS).
- Workers: consume the stream to enrich, dedupe, enforce schema, and route data to storage.
- Analytics store: optimized for large, append-only event data (ClickHouse, BigQuery, Snowflake, Redshift).
- API: exposes consistent query endpoints for dashboards (funnels, cohorts, retention) and permissions.
- UI: dashboards and exploration tools; keep it separate so you can change storage/query logic without rewriting the frontend.
If you want to prototype an internal analytics web app quickly, a vibe-coding platform like Koder.ai can help you stand up the dashboard UI (React) and a backend (Go + PostgreSQL) from a chat-driven spec—useful for getting an initial “working slice” before you harden the pipeline.
Storage: raw events vs. aggregates
Use two layers:
- Append-only raw events for auditability and reprocessing. Treat this as the source of truth.
- Aggregates/materialized views for speed (daily active users by feature, funnel steps, cohort tables). Materialized views are especially useful when the same queries run constantly.
Real-time vs. batch (pick based on decisions)
Choose the freshness your team actually needs:
- Near real-time (seconds/minutes) if you’re monitoring launches, onboarding drop-offs, or outages.
- Daily batch for trend reporting, weekly adoption, and executive summaries—cheaper and often simpler.
Many teams do both: real-time counters for “what’s happening now,” plus nightly jobs that recompute canonical metrics.
Scaling plan: partitioning and growth
Design for growth early by partitioning:
- By time (daily/monthly) to keep queries bounded and retention policies easy.
- By account/tenant to support B2B permissions and performance.
- Optionally by event type if a few high-volume events dominate.
Also plan retention (e.g., 13 months raw, longer aggregates) and a replay path so you can fix bugs by reprocessing events rather than patching dashboards.
Data Modeling for Events and Fast Analytics Queries
Good analytics starts with a model that can answer common questions quickly (funnels, retention, feature usage) without turning every query into a custom engineering project.
Pick a two-tier database strategy
Most teams do best with two stores:
- Relational DB (Postgres/MySQL) for “stable” metadata that changes slowly: users, accounts, feature definitions, access control, and configuration.
- Columnar/warehouse (ClickHouse/BigQuery/Snowflake) for high-volume events, where you need fast scans and aggregations.
This split keeps your product database lean while making analytics queries cheaper and faster.
Define the core tables (and keep them boring)
A practical baseline looks like this:
- raw_events: one row per event (event_name, timestamp, user_id/anonymous_id, session_id, account_id, properties JSON, source).
- users: user profile + current identifiers.
- accounts: company/organization entity for B2B rollups.
- feature_catalog: your canonical list of features (key, display_name, category, lifecycle status).
- sessions: session boundaries (start/end, device, referrer) for behavior analysis.
- aggregates: precomputed daily/weekly metrics (e.g., DAU, feature_active_users, funnel step counts).
In the warehouse, denormalize what you query often (e.g., copy account_id onto events) to avoid expensive joins.
Control cost and speed with retention + partitioning
Partition raw_events by time (daily is common) and optionally by workspace/app. Apply retention by event type:
- Keep high-level product events longer (months/years).
- Expire noisy debug events quickly.
This prevents “infinite growth” from quietly becoming your biggest analytics problem.
Build data quality checks into the model
Treat quality checks as part of modeling, not a later clean-up:
- Missing required properties (e.g., feature_key).
- Bad timestamps (future dates, timezone parsing issues).
- Duplicate events (retries, double instrumentation).
Store validation results (or a rejected-events table) so you can monitor instrumentation health and fix issues before dashboards drift.
Compute Adoption Metrics: Funnels, Cohorts, Retention, and Paths
Once your events are flowing, the next step is turning raw clicks into metrics that answer: “Is this feature actually getting adopted, and by whom?” Focus on four views that work together: funnels, cohorts, retention, and paths.
Funnels: adoption as a sequence (not a single click)
Define a funnel per feature so you can see where users drop off. A practical pattern is:
- Discovery → the user sees the feature entry point (button, menu item, banner)
- First use → the first meaningful interaction (e.g.,
feature_used) - Repeat use → a second use within a reasonable window (e.g., 7 days)
- Value action → the outcome that proves value (export created, automation enabled, report shared)
Keep funnel steps tied to events you trust and name them consistently. If “first use” can happen in multiple ways, treat it as a step with OR conditions (e.g., import_started OR integration_connected).
Cohorts: compare like with like
Cohorts help you measure improvement over time without mixing old and new users. Common cohorts include:
- New users by week (signup week)
- Activated users (reached your activation event)
- Retained users (returned and did something meaningful)
- Power users (high frequency or advanced actions)
Track adoption rates within each cohort to see if recent onboarding or UI changes are helping.
Retention: “do they come back and keep using it?”
Retention is most useful when tied to a feature, not just “app opens.” Define it as repeating the feature’s core event (or value action) on Day 7/30. Also track “time to second use”—it’s often more sensitive than raw retention.
Segmentation and paths: who adopts, and how they get there
Break metrics down by dimensions that explain behavior: plan, role, industry, device, and acquisition channel. Segments often reveal that adoption is strong for one group and near-zero for another.
Add path analysis to find common sequences before and after adoption (e.g., users who adopt often visit pricing, then docs, then connect an integration). Use this to refine onboarding prompts and remove dead ends.
Build Dashboards People Will Actually Use
Dashboards fail when they try to serve everyone with one “master view.” Instead, design a small set of focused pages that match how different people make decisions, and make each page answer a clear question.
Start with audience-specific pages
An executive overview should be a quick health check: adoption trend, active users, top features, and notable changes since the last release. A feature deep dive should be built for PMs and engineers: where users start, where they drop off, and what segments behave differently.
A simple structure that works well:
- Overview: adoption trend, retention trend, and a few headline KPIs
- Feature page: funnel, cohort retention, and usage frequency for one feature
- Segment explorer: compare plans, regions, or workspace sizes side-by-side
Make exploration easy (without making it messy)
Include trend charts for the “what,” segmented breakdowns for the “who,” and drill-down for the “why.” The drill-down should let someone click a bar/point and see example users or workspaces (with appropriate permissions), so teams can validate patterns and investigate real sessions.
Keep filters consistent across pages so users don’t have to relearn controls. The most useful filters for feature adoption tracking are:
- Date range
- Plan / tier
- Workspace / account attributes (size, industry)
- Region
- App version (or release channel)
Sharing, exports, and saved views
Dashboards become part of workflows when people can share exactly what they’re seeing. Add:
- Export to CSV for quick analysis in spreadsheets
- Share with a linkable saved view (filters + chart state + selected segment)
- Optional scheduled email/slack summaries that point back to the saved view
If you’re building this into a product analytics web app, consider a /dashboards page with “Pinned” saved views so stakeholders always land on the few reports that matter.
Add Alerts, Anomalies, and Release Markers
Dashboards are great for exploration, but teams usually notice problems when a customer complains. Alerts flip that: you learn about a breakage minutes after it happens, and you can tie it back to what changed.
Set alert rules that match real failure modes
Start with a few high-signal alerts that protect your core adoption flow:
- Sudden drop in first use (e.g., “Feature X: first_use” events per hour down 40% vs. baseline). This often indicates a UI regression, permissions change, or a tracking bug.
- Spike in errors (client errors, API 4xx/5xx, or “feature_failed” events). Include both absolute thresholds and rate-based thresholds (errors per 1,000 sessions).
- Missing events after a release (event count goes to near-zero). This catches broken instrumentation quickly—especially after refactors.
Keep alert definitions readable and version-controlled (even a simple YAML file in your repo) so they don’t become tribal knowledge.
Anomaly detection: keep it simple first
Basic anomaly detection can be very effective without fancy ML:
- Compare current values to a trailing average (e.g., last 7 days, same hour-of-day).
- Add seasonality awareness where it matters (weekday vs. weekend, business hours vs. night).
- Use a minimum volume rule so low-traffic metrics don’t spam.
Release markers: a timeline for “what changed?”
Add a release marker stream directly into charts: deploys, feature flag rollouts, pricing changes, onboarding tweaks. Each marker should include a timestamp, owner, and a short note. When metrics shift, you’ll immediately see likely causes.
Routing, quiet hours, and ownership
Send alerts to email and Slack-like channels, but support quiet hours and escalation (warn → page) for severe issues. Every alert needs an owner and a runbook link (even a short /docs/alerts page) describing what to check first.
Privacy, Consent, and Access Control
Analytics data quickly becomes personal data if you’re not careful. Treat privacy as part of your tracking design, not a legal afterthought: it reduces risk, builds trust, and prevents painful rework.
Consent: collect only what users agree to
Respect consent requirements and let users opt out where needed. Practically, that means your tracking layer should check a consent flag before sending events, and it should be able to stop tracking mid-session if a user changes their mind.
For regions with stricter rules, consider “consent-gated” features:
- Load analytics libraries only after consent (not just “stop sending”).
- Store the consent decision with a timestamp and version, so you can prove what the user accepted.
- Provide a simple preference UI in your app settings.
Minimize sensitive data (and keep it out of events)
Minimize sensitive data: avoid raw emails in events; use hashed/opaque IDs. Event payloads should describe behavior (what happened), not identity (who the person is). If you need to connect events to an account, send an internal user_id/account_id and keep the mapping in your database with proper security controls.
Also avoid collecting:
- Free-text fields (often contain accidental personal info)
- Full URLs that may include tokens or query parameters
- Anything you wouldn’t want to appear in a screenshot
Be transparent: documentation and a clear privacy page
Document what you collect and why; link to a clear privacy page. Create a lightweight “tracking dictionary” that explains each event, its purpose, and retention period. In your product UI, link to /privacy and keep it readable: what you track, what you don’t, and how to opt out.
Access control: limit who can see user-level data
Implement role-based access so only authorized teams can view user-level data. Most people only need aggregated dashboards; reserve raw event views for a small group (e.g., data/product ops). Add audit logs for exports and user lookups, and set retention limits so old data expires automatically.
Done well, privacy controls won’t slow analysis—they’ll make your analytics system safer, clearer, and easier to maintain.
Rollout Plan, QA, and Long-Term Maintenance
Shipping analytics is like shipping a feature: you want a small, verifiable first release, then steady iteration. Treat tracking work as production code with owners, reviews, and tests.
Start small with “golden events”
Begin with a tight set of golden events for one feature area (for example: Feature Viewed, Feature Started, Feature Completed, Feature Error). These should map directly to questions the team will ask weekly.
Keep scope narrow on purpose: fewer events means you can validate quality quickly, and you’ll learn which properties you actually need (plan, role, source, feature variant) before scaling out.
Validate tracking in staging and production
Use a checklist before you call tracking “done”:
- Event fires once (no double-tracking on refresh, retries, or SPA route changes)
- Required properties present and typed consistently
- PII is excluded or properly masked
- Events are received within expected latency
- Identities link correctly (anonymous → logged-in)
Add sample queries you can run in both staging and production. Examples:
- “Count events by name in the last 30 minutes” (spot missing/extra events)
- “Top 20 property values for
feature_name” (catch typos likeSearchvs.search) - “Completion rate = Completed / Started by app version” (detect release regressions)
Instrumentation QA workflow for every release
Make instrumentation part of your release process:
- Tracking change in the same PR as the UI/API change
- Reviewer checks event names/properties against your schema
- QA verifies events in staging with a known test account
- Release note includes any tracking changes (new events, renamed properties)
Long-term maintenance (schema, backfills, docs)
Plan for change: deprecate events instead of deleting them, version properties when meaning changes, and schedule periodic audits.
When you add a new required property or fix a bug, decide whether you need a backfill (and document the time window where data is partial).
Finally, keep a lightweight tracking guide in your docs and link it from dashboards and PR templates. A good starting point is a short checklist like /blog/event-tracking-checklist.
FAQ
What does “feature adoption” actually mean, and how should I define it?
Start by writing down what “adoption” means for your product:
- Use: tried at least once
- Repeat use: used again within a time window
- Value achieved: reached the outcome the feature is meant to enable
Then choose the definition(s) that best match how your feature delivers value and turn them into measurable events.
Which success metrics should I use to measure adoption reliably?
Pick a small set you can review weekly plus a quick post-release check. Common adoption metrics include:
- Adoption rate among active users/accounts (e.g., in 30 days)
- Funnel conversion (discovery → first use → value)
- Repeat usage or feature retention (e.g., Day 7/30)
- Time-to-first-value (TTFV)
Add explicit thresholds (e.g., “≥ 25% adoption in 30 days”) so results lead to decisions, not debate.
What data entities do I need before I start instrumenting events?
Define core entities up front so reports stay understandable:
- User (anonymous and/or identified)
- Account/workspace (for B2B rollups)
- Feature (often a group of events)
- Event (recorded action)
- Outcome (value milestone)
For each event, capture at minimum user_id (or anonymous_id), account_id (if applicable), timestamp, and a small set of relevant properties (plan/role/device/flag).
How do I design an event naming convention that won’t drift over time?
Use a consistent convention like verb_noun and stick to one tense (past or present) across the product.
Practical rules:
- Avoid synonyms that mean the same thing (
clickedvspressed) - Prefer “meaningful actions” over UI noise (e.g.,
report_exportedvs every hover) - Define a stable
feature_key(e.g.,bulk_upload) rather than relying on display names
Document names and when they fire in an instrumentation spec stored with your code.
What properties should every event include as a required contract?
Create a minimal “event contract” so every event can be segmented and joined later. A common baseline:
user_id(nullable if anonymous)anonymous_id(for pre-login behavior)account_id(for B2B/multi-seat)timestamp(server-generated when possible)feature_keyplan(or tier)
Keep optional properties limited and consistent (same keys and value formats across events).
Should I track events client-side, server-side, or both?
Track intent in the browser and success on the server.
- Client-side: UI interactions, page/screen context, UTMs, referrer
- Server-side: completed outcomes (payment succeeded, export generated, invite accepted)
This hybrid approach reduces data loss from ad blockers/reloads while keeping adoption metrics trustworthy. If you need to connect context, pass a context_id (request ID) from client → API and attach it to server events.
How do I handle anonymous users, logins, and account switching without double counting?
Use three stable keys:
anonymous_id(per browser/device)user_id(per person)account_id(per workspace)
Link anonymous → identified only after strong proof (successful login, verified magic link, SSO). Track auth transitions as events (login_success, logout, account_switched) and avoid rotating the anonymous cookie on logout to prevent fragmented sessions and inflated uniques.
How do I compute adoption using funnels, cohorts, and retention?
Adoption is rarely a single click, so model it as a funnel:
- Discovery (entry point seen)
- First use (first meaningful action)
- Repeat use (second use within a window)
- Value action (the outcome that proves value)
If “first use” can happen multiple ways, define that step with OR conditions (e.g., import_started OR integration_connected) and keep steps tied to events you trust (often server-side for outcomes).
What dashboards should I build so teams actually use the analytics?
Start with a few focused pages mapped to decisions:
- Overview: adoption and retention trends, top features, changes since last release
- Feature deep dive: funnel drop-offs, segment differences, usage frequency
- Segment explorer: plan/role/region/workspace size comparisons
Keep filters consistent across pages (date range, plan, account attributes, region, app version). Add saved views and CSV export so stakeholders can share exactly what they’re seeing.
How do I ensure data quality, privacy, and long-term maintenance for tracking?
Build safeguards into your pipeline and process:
- Golden events: start small with a core set per feature area
- QA checklist: no double-firing, required properties present, PII excluded, identities link correctly, latency within target
- Schema versioning: add
event_versionand deprecate rather than delete - Quality monitoring: alert on missing events, sudden drops, and spikes in errors
Also treat privacy as design: consent gating, avoid raw emails/free-text in events, and restrict access to user-level data with roles + audit logs.