Apr 04, 2025·8 min
How to Build a Web App for Internal Tool Reliability Tracking
Learn how to design and build a web app that tracks internal tool reliability with SLIs/SLOs, incident workflow, dashboards, alerts, and reporting.
Learn how to design and build a web app that tracks internal tool reliability with SLIs/SLOs, incident workflow, dashboards, alerts, and reporting.
Before you pick metrics or build dashboards, decide what your reliability app is responsible for—and what it is not. A clear scope prevents the tool from turning into a catch‑all “ops portal” that nobody trusts.
Start by listing the internal tools the app will cover (e.g., ticketing, payroll, CRM integrations, data pipelines) and the teams that own or depend on them. Be explicit about boundaries: “customer-facing website” might be out of scope, while “internal admin console” is in.
Different organizations use the word differently. Write down your working definition in plain language—typically a mix of:
If teams disagree, your app will end up comparing apples to oranges.
Pick 1–3 primary outcomes, such as:
These outcomes will later guide what you measure and how you present it.
List who will use the app and what decisions they make: engineers investigating incidents, support escalating issues, managers reviewing trends, and stakeholders needing status updates. This will shape terminology, permissions, and the level of detail each view should show.
Reliability tracking only works if everyone agrees on what “good” means. Start by separating three similar-sounding terms.
An SLI (Service Level Indicator) is a measurement: “What percent of requests succeeded?” or “How long did pages take to load?”
An SLO (Service Level Objective) is the target for that measurement: “99.9% success over 30 days.”
An SLA (Service Level Agreement) is a promise with consequences, usually external-facing (credits, penalties). For internal tools, you’ll often set SLOs without formal SLAs—enough to align expectations without turning reliability into contract law.
Keep it comparable across tools and easy to explain. A practical baseline is:
Avoid adding more until you can answer: “What decision will this metric drive?”
Use rolling windows so scorecards update continuously:
Your app should turn metrics into action. Define severity levels (e.g., Sev1–Sev3) and explicit triggers such as:
These definitions make alerting, incident timelines, and error budget tracking consistent across teams.
A reliability tracking app is only as credible as the data behind it. Before building ingestion pipelines, map every signal you’ll treat as “truth” and write down what question it answers (availability, latency, errors, deploy impact, incident response).
Most teams can cover the basics using a mix of:
Be explicit about which systems are authoritative. For example, your “uptime SLI” might be sourced only from synthetic probes, not server logs.
Set update frequency by use case: dashboards may refresh every 1–5 minutes, while scorecards can be computed hourly/daily.
Create consistent IDs for tools/services, environments (prod/stage), and owners. Agree on naming rules early so “Payments-API”, “payments_api”, and “payments” don’t become three separate entities.
Plan what to keep and for how long (e.g., raw events 30–90 days, daily aggregates 12–24 months). Avoid ingesting sensitive payloads; store only metadata needed for reliability analysis (timestamps, status codes, latency buckets, incident tags).
Your schema should make two things easy: answering day-to-day questions (“is this tool healthy?”) and reconstructing what happened during an incident (“when did symptoms start, who changed what, what alerts fired?”). Start with a small set of core entities and make relationships explicit.
A practical baseline is:
This structure supports dashboards (“tool → current status → recent incidents”) and drill-down (“incident → events → related checks and metrics”).
Add audit fields everywhere you need accountability and history:
created_by, created_at, updated_atstatus plus status change tracking (either in the Event table or a dedicated history table)Finally, include flexible tags for filtering and reporting (e.g., team, criticality, system, compliance). A tool_tags join table (tool_id, key, value) keeps tagging consistent and makes scorecards and rollups much easier later.
Your reliability tracker should be boring in the best way: easy to run, easy to change, and easy to support. The “right” stack is usually the one your team can maintain without heroics.
Pick a mainstream web framework your team knows well—Node/Express, Django, or Rails are all solid options. Prioritize:
If you’re integrating with internal systems (SSO, ticketing, chat), choose the ecosystem where those integrations are easiest for you.
If you want to accelerate the first iteration, a vibe-coding platform like Koder.ai can be a practical starting point: you can describe your entities (tools, checks, SLOs, incidents), workflows (alert → incident → postmortem), and dashboards in chat, then generate a working web app scaffold quickly. Because Koder.ai commonly targets React on the frontend and Go + PostgreSQL on the backend, it maps well to the “boring, maintainable” default stack many teams prefer—and you can export the source code if you later move to a fully manual pipeline.
For most internal reliability apps, PostgreSQL is the right default: it handles relational reporting, time-based queries, and auditing well.
Add extra components only when they solve a real problem:
Decide between:
Whichever you choose, standardize dev/staging/prod and automate deployments (CI/CD), so changes don’t silently alter reliability numbers. If you use a platform approach (including Koder.ai), look for features like environment separation, deployment/hosting, and fast rollback (snapshots) so you can safely iterate without breaking the tracker itself.
Document configuration in one place: environment variables, secrets, and feature flags. Keep a clear “how to run locally” guide and a minimal runbook (what to do if ingestion stops, the queue backs up, or the database hits limits). A short page in /docs is often enough.
A reliability tracking app succeeds when people can answer two questions in seconds: “Are we okay?” and “What do I do next?” Design screens around those decisions, with clear navigation from overview → specific tool → specific incident.
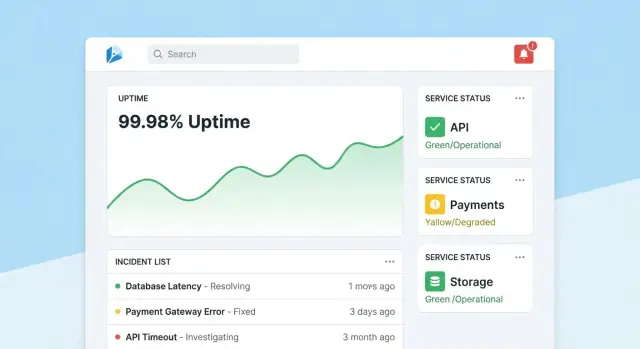
Make the homepage a compact command center. Lead with an overall health summary (e.g., number of tools meeting SLOs, active incidents, biggest current risks), then show recent incidents and alerts with status badges.
Keep the default view calm: highlight only what needs attention. Give every tile a direct drill-down to the affected tool or incident.
Each tool page should answer “Is this tool reliable enough?” and “Why/why not?” Include:
Design charts for non-experts: label units, mark SLO thresholds, and add small explanations (tooltips) rather than dense technical controls.
An incident page is a living record. Include a timeline (auto-captured events like alert fired, acknowledged, mitigated), human updates, impacted users, and actions taken.
Make updates easy to publish: one text box, predefined status (Investigating/Identified/Monitoring/Resolved), and optional internal notes. When the incident is closed, a “Start postmortem” action should prefill facts from the timeline.
Admins need simple screens to manage tools, checks, SLO targets, and owners. Optimize for correctness: sensible defaults, validation, and warnings when changes affect reporting. Add a visible “last edited” trail so people trust the numbers.
Reliability data only stays useful if people trust it. That means tying every change to an identity, limiting who can make high-impact edits, and keeping a clear history you can refer back to during reviews.
For an internal tool, default to SSO (SAML) or OAuth/OIDC via your identity provider (Okta, Azure AD, Google Workspace). This reduces password management and makes onboarding/offboarding automatic.
Practical details:
Start with simple roles and add finer-grained rules only when needed:
Protect actions that can change reliability outcomes or reporting narratives:
Log every edit to SLOs, checks, and incident fields with:
Make audit logs searchable and visible from the relevant detail pages (e.g., an incident page shows its full change history). This keeps reviews factual and reduces back-and-forth during postmortems.
Monitoring is the “sensor layer” of your reliability app: it turns real behavior into data you can trust. For internal tools, synthetic checks are often the fastest path because you control what “healthy” means.
Start with a small set of check types that cover most internal apps:
Keep checks deterministic. If a validation can fail because of changing content, you’ll create noise and erode confidence.
For each check run, capture:
Store data either as time-series events (one row per check run) or as aggregated intervals (e.g., per-minute rollups with counts and p95 latency). Event data is great for debugging; rollups are great for fast dashboards. Many teams do both: keep raw events for 7–30 days and rollups for longer-term reporting.
A missing check result should not automatically mean “down.” Add an explicit unknown state for cases like:
This prevents inflated downtime and makes “monitoring gaps” visible as their own operational issue.
Use background workers (cron-like scheduling, queues) to run checks at fixed intervals (e.g., every 30–60 seconds for critical tools). Build in timeouts, retries with backoff, and concurrency limits so your checker doesn’t overload internal services. Persist every run result—even failures—so your uptime monitoring dashboard can show both current status and a reliable history.
Alerts are where reliability tracking turns into action. The goal is simple: notify the right people, with the right context, at the right time—without flooding everyone.
Start by defining alert rules that map directly to your SLIs/SLOs. Two practical patterns:
For each rule, store the “why” alongside the “what”: which SLO is impacted, the evaluation window, and the intended severity.
Send notifications through the channels your teams already live in (email, Slack, Microsoft Teams). Every message should include:
Avoid dumping raw metrics. Provide a short “next step” like “Check recent deploys” or “Open logs.”
Implement:
Even in an internal tool, people need control. Add manual escalation (button on the alert/incident page) and integrate with on-call tooling if available (PagerDuty/Opsgenie equivalents), or at least a configurable rotation list stored in your app.
Incident management turns “we saw an alert” into a shared, trackable response. Build this into your reliability app so people can move from signal to coordination without jumping between tools.
Make it possible to create an incident directly from an alert, a service page, or an uptime chart. Pre-fill key fields (service, environment, alert source, first seen time) and assign a unique incident ID.
A good default set of fields keeps this lightweight: severity, customer impact (internal teams affected), current owner, and links to the triggering alert.
Use a simple lifecycle that matches how teams actually work:
Each status change should capture who made the change and when. Add timeline updates (short, timestamped notes), plus support for attachments and links to runbooks and tickets (e.g., /runbooks/payments-retries or /tickets/INC-1234). This becomes the single thread for “what happened and what we did.”
Postmortems should be fast to start and consistent to review. Provide templates with:
Tie action items back to the incident, track completion, and surface overdue items on team dashboards. If you support “learning reviews,” allow a “blameless” mode that focuses on system and process changes rather than individual mistakes.
Reporting is where reliability tracking becomes decision-making. Dashboards help operators; scorecards help leaders understand whether internal tools are improving, which areas need investment, and what “good” looks like.
Build a consistent, repeatable view per tool (and optionally per team) that answers a few questions quickly:
Where you can, add lightweight context: “SLO missed due to 2 deployments” or “Most downtime from dependency X,” without turning the report into a full incident review.
Leaders rarely want “everything.” Add filters for team, tool criticality (e.g., Tier 0–3), and time window. Ensure the same tool can appear in multiple rollups (platform team owns it, finance relies on it).
Provide weekly and monthly summaries that can be shared outside the app:
Keep the narrative consistent (“What changed since last period?” “Where are we over budget?”). If you need a primer for stakeholders, link to a short guide like /blog/sli-slo-basics.
A reliability tracker quickly becomes a source of truth. Treat it like a production system: secure by default, resistant to bad data, and easy to recover when something goes wrong.
Lock down every endpoint—even “internal-only” ones.
Keep credentials out of code and out of logs.
Store secrets in a secret manager and rotate them. Give the web app least-privilege database access: separate read/write roles, restrict access to only the tables it needs, and use short-lived credentials where possible. Encrypt data in transit (TLS) between browser↔app and app↔database.
Reliability metrics are only useful if the underlying events are trustworthy.
Add server-side checks for timestamps (timezone/clock skew), required fields, and idempotency keys to deduplicate retries. Track ingestion errors in a dead-letter queue or “quarantine” table so bad events don’t poison dashboards.
Automate database migrations and test rollbacks. Schedule backups, regularly restore-test them, and document a minimal disaster recovery plan (who, what, how long).
Finally, make the reliability app itself reliable: add health checks, basic monitoring for queue lag and DB latency, and alert when ingestion silently drops to zero.
A reliability tracking app succeeds when people trust it and actually use it. Treat the first release as a learning loop, not a “big bang” launch.
Pick 2–3 internal tools that are widely used and have clear owners. Implement a small set of checks (for example: homepage availability, login success, and a key API endpoint) and publish one dashboard that answers: “Is it up? If not, what changed and who owns it?”
Keep the pilot visible but contained: one team or a small group of power users is enough to validate the flow.
In the first 1–2 weeks, actively gather feedback on:
Turn feedback into concrete backlog items. A simple “Report an issue with this metric” button on each chart often surfaces the fastest insights.
Add value in layers: connect to your chat tool for notifications, then your incident tool for automatic ticket creation, then CI/CD for deploy markers. Each integration should reduce manual work or shorten time-to-diagnosis—otherwise it’s just complexity.
If you’re prototyping quickly, consider using Koder.ai’s planning mode to map the initial scope (entities, roles, and workflows) before generating the first build. It’s a simple way to keep the MVP tight—and because you can snapshot and roll back, you can iterate on dashboards and ingestion safely as teams refine definitions.
Before rolling out to more teams, define success metrics like dashboard weekly active users, reduced time-to-detect, fewer duplicate alerts, or consistent SLO reviews. Publish a lightweight roadmap in /blog/reliability-tracking-roadmap and expand tool-by-tool with clear owners and training sessions.
Start by defining the scope (which tools and environments are included) and your working definition of reliability (availability, latency, errors). Then pick 1–3 outcomes you want to improve (e.g., faster detection, clearer reporting) and design the first screens around the core decisions users need to make: “Are we okay?” and “What do I do next?”
An SLI is what you measure (e.g., % successful requests, p95 latency). An SLO is the target for that measurement (e.g., 99.9% over 30 days). An SLA is a formal promise with consequences (often external-facing). For internal tools, SLOs usually provide alignment without the overhead of SLA-style enforcement.
Use a small baseline set that stays comparable across tools:
Add more only if you can name the decision it will drive (alerting, prioritization, capacity work, etc.).
Rolling windows keep scorecards continuously up to date:
Pick windows that match how your org reviews performance so the numbers feel intuitive and get used.
Define explicit severity triggers tied to user impact and duration, such as:
Write these rules down in the app so alerting, incident timelines, and reporting stay consistent across teams.
Start by mapping which system is the “source of truth” for each question:
Be explicit (e.g., “uptime SLI comes only from probes”), otherwise teams will argue about which numbers count.
Use pull for systems you can poll on a schedule (monitoring APIs, ticketing APIs). Use push (webhooks/events) for high-volume or near-real-time events (deploys, alerts, incident updates). A common split is dashboards refreshing every 1–5 minutes, while scorecards compute hourly or daily.
You’ll typically need:
Log every high-impact edit with who, when, what changed (before/after), and where it came from (UI/API/automation). Combine that with role-based access:
These guardrails prevent silent changes that undermine trust in your reliability numbers.
Treat missing check results as a separate unknown state, not automatic downtime. Missing data can come from:
Making “unknown” visible prevents inflated downtime and surfaces monitoring gaps as their own operational problem.
Make relationships explicit (tool → checks → metrics; incident → events) so “overview → drill-down” queries stay simple.