

How to Build a Website for Your Product Experiment Log
Learn how to plan, design, and launch a website that documents product experiments with consistent entries, tagging, search, and clear results.
What a Product Experimentation Log Website Does
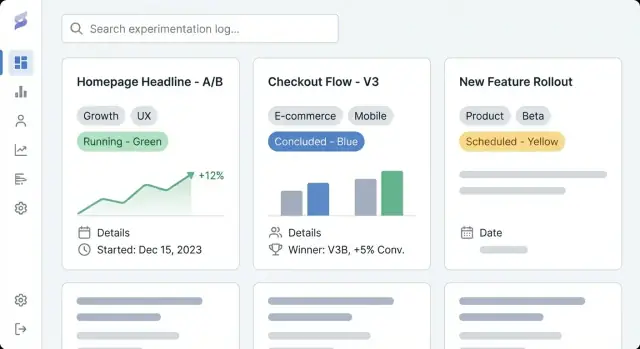
A product experimentation log website is a shared place to document every experiment your team runs—A/B tests, pricing trials, onboarding tweaks, feature flags, email experiments, and even “failed” ideas that still taught you something. Think of it as an experiment repository and product learning log combined: a record of what you tried, why you tried it, what happened, and what you decided next.
Why teams use one
Most teams already have fragments of experiment tracking spread across docs, dashboards, and chat threads. A dedicated experiment tracking website pulls those artifacts into a single, navigable history.
The practical outcomes are:
- Visibility: anyone can quickly see what’s running now, what shipped, what was stopped, and what’s planned—without hunting through tools.
- Repeatability: teams can reuse experiment templates, avoid re-testing the same hypothesis, and copy proven methods (targeting, metrics, duration).
- Shared learning: results and context stay available long after a project ends, so new teammates can understand past decisions and build on them.
What you’ll get from this guide
This guide focuses on how to build a website that makes experiment documentation easy to create and easy to use. We’ll cover how to plan structure and navigation, define an experiment entry data model (so entries stay consistent), create readable page templates, set up tagging and search for fast discovery, and choose the right implementation approach (CMS vs. custom app).
By the end, you’ll have a clear plan for an A/B test documentation site that supports day-to-day product work—capturing hypotheses, metrics and results reporting, and decisions in a way that’s searchable, trustworthy, and useful over time.
Define Goals, Audience, and Access Level
Before you pick tools or design experiment templates, get clear on why this experiment tracking website exists and who it serves. A product experimentation log is only useful if it matches how your teams actually make decisions.
Set clear goals (what “good” looks like)
Write down 2–4 measurable outcomes for the experiment repository. Common definitions of success include:
- Faster discovery: people can find relevant A/B test documentation in minutes, not hours.
- Fewer duplicate tests: teams see what’s already been tried and avoid rerunning the same idea.
- Better decisions: more consistent metrics and results reporting, with clearer links between hypotheses, changes, and outcomes.
These goals should influence everything later: what fields you require in each entry, how strict your workflow is, and how advanced your tagging and search needs to be.
Identify primary users and their needs
List your primary audiences and what they need to do in the product learning log:
- Product: scan past experiments, compare outcomes, reuse successful patterns.
- Design: understand what changes were tested and why; review screenshots or specs.
- Engineering: confirm implementation details, guardrails, and technical constraints.
- Leadership: review impact and quality of learning without reading every detail.
- Support/Customer-facing teams: know what changed and what to tell users.
A simple way to validate this: ask each group, “What question do you want answered in 30 seconds?” Then make sure your experiment templates and page layout support that.
Choose an access model: internal, public, or mixed
Decide early whether your CMS for experiment logs should be:
- Internal-only: best for sensitive metrics, roadmap details, or user data.
- Public: useful for transparency and hiring, but requires stricter review and redaction.
- Mixed: a private internal log plus a curated public subset.
If you choose mixed access, define what’s allowed in public entries (e.g., no raw metrics, anonymized segments, no unreleased feature names) and who approves publication. This prevents rework later when your team wants to share learnings externally.
Plan the Site Structure and Navigation
A product experimentation log only works if people can find the right experiment in under a minute. Before you pick tools or design screens, decide how someone will browse your experiment tracking website when they don’t know what they’re looking for.
Choose clear top-level navigation
Keep the main navigation limited and predictable. A practical starting point is:
- Experiments (your experiment repository)
- Playbooks (how-to guidance, experiment templates, checklists)
- Metrics (definitions, owners, tracking notes)
- Teams (who’s running what)
If “Metrics” feels heavy, you can link to it from Experiments at first and expand later.
Pick your primary organizing logic
Decide the main “shape” of browsing. Most product learning logs work best with one primary view and the rest handled by filters:
- By product area (e.g., Checkout, Search, Onboarding)
- By funnel stage (Acquisition → Activation → Retention)
- By team (Growth, Core, Mobile)
Choose the one your stakeholders already use in conversations. Everything else can be tags (e.g., platform, hypothesis theme, segment, experiment type).
Plan URLs, breadcrumbs, and “back to list” paths
Make URLs readable and stable so people can share them in Slack and tickets:
/experiments/2025-12-checkout-free-shipping-threshold
Add breadcrumbs like Experiments → Checkout → Free shipping threshold to prevent dead ends and keep scanning intuitive.
Create a lightweight content inventory
List what you’ll publish on day one versus later: recent experiments, top playbooks, a core metrics glossary, and team pages. Prioritize entries that will be referenced often (high-impact tests, canonical experiment templates, and metric definitions used in results reporting).
Design the Experiment Entry Data Model
A useful product experimentation log isn’t just a list of links—it’s a database of learnings. The data model is the “shape” of that database: what you store, how entries relate, and which fields must be present so experiments stay comparable over time.
Core content types (what you’ll store)
Start with a small set of content types that match how teams actually work:
- Experiment: the main record (what you tested and what happened).
- Metric: a defined measurement you reuse across experiments (e.g., activation rate, churn, revenue per user).
- Insight: a reusable learning that can outlive a single test (e.g., “removing friction on step 2 increases completion”).
- Decision: what you chose to do after the results (ship, iterate, rollback, or archive).
Keeping these separate prevents every experiment from inventing new metric names or burying decisions in free-text notes.
Minimum fields for every experiment entry
Make the “minimum viable entry” easy to complete. At a minimum, require:
- Title (clear, specific)
- Hypothesis (what you expected and why)
- Owner (single accountable person)
- Start date / End date (or planned dates)
- Status (from a standard set)
Optional—but often valuable—fields include target audience, traffic allocation, test type (A/B, multivariate), and links to tickets or designs.
Result fields that capture the learning
Results are where logs usually fall apart, so standardize them:
- Primary metric (selected from your Metric list)
- Impact (direction + magnitude; include units)
- Confidence notes (plain-language explanation of certainty, caveats, data quality)
- Supporting evidence (screenshots, charts, or a short summary of what you looked at)
If you allow attachments, keep a consistent slot for screenshots so readers know where to look.
Relationships and statuses
Model relationships explicitly so discovery and reporting work later:
- Experiments ↔ Metrics (primary + secondary metrics)
- Experiments ↔ Features/Areas (what part of the product changed)
- Experiments ↔ Owners/Teams (accountability and routing)
Standardize statuses so sorting and dashboards stay meaningful: proposed, running, concluded, shipped, archived. This prevents “done,” “complete,” and “finished” from turning into three different states.
Create Page Templates That Make Experiments Easy to Read
Good templates turn “someone’s notes” into a shared record the whole company can scan, trust, and reuse. The goal is consistency without making authors feel like they’re filling out paperwork.
Experiment detail page: recommended sections (in order)
Start with the information a reader needs to decide whether to keep reading.
- Summary (TL;DR): one paragraph: what you changed, who it affected, and the outcome.
- Status and key metadata: status, owner, team, start/end dates, link to PRD/ticket (
/docs/...), and primary metric. - Hypothesis: a single, testable statement (avoid vague goals like “improve engagement”).
- Design: variants, targeting, allocation, guardrails, and duration assumptions.
- Results: primary metric first, then secondary/guardrail metrics, with a plain-language interpretation.
- Decision: ship/iterate/rollback, plus what changed in the product.
- Learnings and follow-ups: what you learned, open questions, and next experiments.
- Appendix: screenshots, SQL snippets, raw charts, and links.
List page: quick-scan fields and controls
Your index page should behave like a dashboard. Include filters for status, team, tag, date range, and platform; sorting by recently updated, start date, and (if you can quantify it) impact; and quick-scan fields like status, owner, start/end dates, and a one-line result.
Templates for consistency across teams
Create one default template plus optional variants (e.g., “A/B test,” “Pricing test,” “Onboarding experiment”). Prefill headings, example text, and required fields so authors don’t start from a blank page.
Mobile-friendly, readable for long notes
Use a single-column layout, generous line spacing, and clear typography. Keep key facts in a sticky summary block (where it makes sense), and make tables horizontally scrollable so results stay readable on phones.
Set Up Tagging and Taxonomy for Fast Discovery
A product experimentation log is only useful if people can quickly find relevant learnings. Tagging and taxonomy turn a pile of experiment pages into something you can browse, filter, and reuse.
Start with a small, predictable tagging strategy
Define a handful of tag groups that match how your team naturally searches. A practical baseline is:
- Product area (e.g., Onboarding, Checkout, Notifications)
- Hypothesis type (e.g., Friction reduction, Pricing sensitivity, Trust signal)
- Primary metric (e.g., Activation rate, Conversion rate, Retention)
- Segment (e.g., New users, SMB, Mobile-only)
Keep the number of groups limited. Too many dimensions makes filtering confusing and encourages inconsistent tagging.
Prevent tag sprawl with naming rules
Uncontrolled tags quickly become “signup,” “sign-up,” and “registration” all at once. Create a controlled vocabulary:
- Choose one format (singular vs. plural, capitalization, use of acronyms).
- Define who can create new tags and how they’re approved.
- Add short descriptions for ambiguous tags (what it means, when to use it).
A simple approach is a “tag registry” page the team maintains (e.g., /experiment-tags) plus lightweight review during experiment write-ups.
Use structured fields for what shouldn’t be free text
Tags are great for discovery, but some attributes should be structured fields to stay consistent:
- Status (Proposed, Running, Shipped, Stopped)
- Team/Owner (choose from a list)
- Experiment type (A/B, multivariate, holdout)
Structured fields power reliable filters and dashboards, while tags capture nuance.
Support cross-links: related and similar experiments
Help readers jump between connected work. Add sections like Related experiments (same feature or metric) and Similar hypotheses (same assumption tested elsewhere). This can be manual links at first, then later automated with “shared tags” rules to suggest neighbors.
Choose Between a CMS and a Custom Application
This decision sets the ceiling for what your product experimentation log can become. A CMS can get you publishing quickly, while a custom application can turn the log into a tightly integrated system for decision-making.
When a CMS is enough
A CMS is a good fit when your main need is consistent, readable A/B test documentation with light structure.
Use a CMS if you want:
- Simple publishing: create, edit, review, and publish experiment entries like articles
- Familiar editor experience for PMs, designers, and marketers
- Built-in permissions (who can draft vs. approve vs. publish)
- Basic tagging and categories without complex rules
Typical pattern: a headless CMS (content stored in the CMS, presented by your site) paired with a static site generator. This keeps the experiment repository fast, easy to host, and friendly for non-technical contributors.
When a custom build fits
A custom experiment tracking website makes sense when the log must connect directly to your product data and internal tools.
Consider a custom app if you need:
- Deep integrations (feature flags, analytics tools, data warehouse, ticketing)
- Advanced search and filtering (saved views by team, metric, platform, confidence level)
- Workflow rules (mandatory fields, approvals by area owner, automatic status changes)
- Automated metrics and results reporting (pulling results rather than copying screenshots)
If you want to prototype this quickly, a vibe-coding platform like Koder.ai can be a practical shortcut: you can describe the data model (experiments, metrics, decisions), page templates, and workflows in chat, then iterate on a working React + Go + PostgreSQL app, with deployment/hosting, source export, and snapshots/rollback for safe changes.
Decide your “source of truth”
Be explicit about where experiment data lives.
- If the CMS is the source of truth, your analytics links and results summaries should point back to the CMS entry.
- If the database/app is the source of truth, the website should be a view layer over structured records, with narrative commentary stored separately (optionally in a CMS).
Write this down early—otherwise teams end up with duplicate entries across docs, spreadsheets, and tools, and the product learning log stops being trusted.
Pick a Tech Stack and Hosting Approach
Your experimentation log doesn’t need exotic technology. The best stack is the one your team can operate confidently, keep secure, and evolve without friction.
Static site vs. server-rendered vs. single-page app
A static site (pre-built pages) is often the simplest choice: fast, inexpensive to host, and low maintenance. It works well if experiments are mostly read-only and updates happen through a CMS or pull requests.
A server-rendered app (pages generated on request) is a good fit when you need stronger access control, dynamic filters, or per-team views without complex client logic. It’s also easier to enforce permissions at the server level.
A single-page app (SPA) can feel very responsive for filtering and dashboards, but it adds complexity around SEO, auth, and initial load performance. Choose it only if you truly need app-like interactions.
If you’re building a custom app, also decide whether you want a conventional build pipeline or an accelerated approach. For example, Koder.ai can generate the core scaffolding (React UI, Go API, PostgreSQL schema) from a written spec, which is useful when you’re iterating on templates and workflows with multiple stakeholders.
Hosting basics that prevent painful surprises
Prioritize reliability (uptime, monitoring, alerting) and backups (automated, tested restores). Keep environment separation: at minimum, a staging environment for trying taxonomy changes, template updates, and permission rules before production.
Authentication and private areas
Most teams eventually need SSO (Okta, Google Workspace, Azure AD), plus roles (viewer, editor, admin) and private areas for sensitive learnings (revenue, user data, legal notes). Plan this early so you don’t re-architect later.
Performance basics you can’t ignore
Use caching (CDN and browser caching), keep pages lightweight, and optimize media (compressed images, lazy loading where appropriate). Fast page speed matters because people won’t use a log that feels slow—especially when they’re trying to find a past test during a meeting.
Implement Search, Filters, and Saved Views
A product experimentation log becomes truly useful when people can find “that one test” in seconds—without knowing the exact title.
On-site search vs. an external search service
On-site search (built into your CMS or app database) is usually enough when you have a few hundred experiments, a small team, and simple needs like searching titles, summaries, and tags. It’s easier to maintain and avoids extra vendor setup.
An external search service (like Algolia/Elastic/OpenSearch) is worth it when you have thousands of entries, need lightning-fast results, want typo-tolerance and synonyms (e.g., “checkout” = “purchase”), or need advanced ranking so the most relevant experiments show up first. External search is also helpful if your content spans multiple sources (docs + log + wiki).
Must-have filters that match how teams work
Search alone isn’t enough. Add filters that reflect real decision-making:
- Status: proposed, running, paused, concluded, shipped, invalidated
- Date range: started, ended, and last updated
- Owner and team: who can answer questions quickly
- Tags: feature area, audience segment, hypothesis type
- Primary metric (and optionally guardrails): helps compare similar experiments
Make filters combinable (e.g., “Concluded + Last 90 days + Growth team + Activation metric”).
Saved views people actually reuse
Saved views turn recurring questions into one-click answers:
- Running now (status = running)
- High impact (lift above a threshold, or decision = ship)
- Recently concluded (ended in last 30 days)
Allow teams to pin shared views to navigation, and let individuals save personal views.
Make results scannable in the list view
In search results, show a short results snippet: hypothesis, variant, audience, and the headline outcome. Highlight matched keywords in the title and summary, and surface a few key fields (status, owner, primary metric) so users can decide what to open without clicking into five pages.
Define Workflow, Ownership, and Governance
A great experiment tracking website isn’t just pages and tags—it’s a shared process. Clear ownership and a lightweight workflow prevent half-finished entries, missing results, and “mystery decisions” months later.
Roles and permissions
Start by deciding who can create, edit, approve, and publish experiment entries. A simple model works for most teams:
- Authors (PMs, analysts, designers): create drafts and update results
- Reviewers (data/analytics, research, engineering): verify metrics, instrumentation, and interpretation
- Approvers (product lead or experimentation council): confirm decision and rollout plan
- Publishers (optional): final check for formatting and redactions
Keep permissions consistent with your access level decisions (public vs. internal vs. restricted). If you support private experiments, require an explicit owner for each entry.
Editorial checklist (what “done” means)
Define a short checklist that every experiment must satisfy before publishing:
- Hypothesis is specific and falsifiable (what changes, for whom, expected direction)
- Primary metric is defined (exact name, source, calculation window)
- Guardrails are listed (e.g., revenue, error rate, support tickets)
- Rollout decision is documented (ship, iterate, stop) with rationale
This checklist can be a required form section inside your experiment templates.
Version history and change notes
Treat entries like living documents. Enable version history and require brief change notes for material updates (metric fix, analysis correction, decision reversal). This keeps trust high and makes audits painless.
Handling sensitive information
Decide upfront how you’ll store sensitive info:
- Redactions for customer names, partner terms, or security details
- Private notes visible only to a restricted group
- Split pages: a public summary plus a restricted “analysis and data” page
Governance doesn’t need to be heavy. It just needs to be explicit.
Add Analytics and Privacy-Safe Measurement
An experiment tracking website is only useful if people can find, trust, and reuse what’s inside it. Lightweight analytics helps you spot where the log is working—and where it’s quietly failing—without turning the site into a surveillance tool.
Track usage without over-collecting
Start with a few practical signals:
- Top searches and zero-result searches: if people keep searching for “pricing test” and get nothing, your taxonomy or naming needs work.
- Most viewed experiments and most visited tags: these reveal what teams care about and which areas deserve better templates.
- Broken links and 404s: experiment logs often reference specs, dashboards, or tickets; broken links reduce trust fast.
If your analytics tool supports it, disable IP logging and avoid user-level identifiers. Prefer aggregated, page-level reporting.
Measure content health (quality, not clicks)
Usage metrics won’t tell you if entries are complete. Add “content health” checks that report on the repository itself:
- Missing required fields (e.g., hypothesis, primary metric, decision, owner)
- Stale statuses (e.g., Running for 90+ days)
- Outdated outcomes (e.g., TBD after a decision date)
This can be as simple as a weekly report from your CMS/database or a small script that flags entries. The goal is to make gaps visible so owners can fix them.
Privacy basics for experiment entries
Experiment write-ups should almost never contain personal user data. Keep entries free of:
- names, emails, user IDs, session replays, raw event logs
- screenshots that contain personal information
Link to aggregated dashboards instead of embedding raw datasets, and store sensitive analysis in approved systems.
Add a clear interpretation disclaimer
A/B test results are easy to misread out of context. Add a short disclaimer in your experiment template (and/or footer) noting that:
- results depend on the defined population, timeframe, and instrumentation
- confidence/significance thresholds vary by team
- decisions should reference the documented primary metric and guardrails
This keeps the log honest and reduces “cargo-cult” reuse of past outcomes.
Prepare for Launch, Migration, and Ongoing Maintenance
A great experiment log isn’t “done” when the site is live. The real value shows up when teams trust it, keep it current, and can still find learnings six months later.
Migrate existing experiments (without chaos)
Most teams start with spreadsheets, slide decks, or scattered docs. Pick a small pilot batch (e.g., last quarter’s experiments) and map each source field to your new template.
If you can, import in bulk: export spreadsheets to CSV, then script or use a CMS importer to create entries in the new format. For documents, migrate the key summary fields first (goal, change, results, decision) and link to the original file for supporting detail.
Do a quality pass before launch
Run one pass focused on consistency, not perfection. Common issues to catch:
- Duplicate or near-duplicate tags (e.g., onboarding vs. on-boarding)
- Missing owners (every experiment needs a name, not “team”) and missing dates
- Inconsistent statuses (draft, running, stopped, shipped, invalidated) and unclear outcomes
This is also a good moment to agree on required fields for anything marked as completed.
Launch checklist
Before announcing it, verify:
- Permissions: who can view, who can edit, and who can publish
- Search indexing: the main experiment pages and tags should be discoverable
- Redirects: if you’re replacing an old wiki space, set redirects to preserve links
- Backups: confirm automated backups and a restore test (even a simple one)
Post-launch maintenance rhythm
Set a light routine: monthly cleanup (stale drafts, missing results) and a quarterly taxonomy review (merge tags, add new categories thoughtfully).
Optional next steps
Once the basics are stable, consider integrations: auto-link experiments to issue trackers, or pull in analytics context so each entry points to the exact dashboard used for results reporting.
If you’re evolving toward a custom application, you can also iterate in “planning mode” first—writing down workflows, required fields, and approval rules—then implement them. Platforms like Koder.ai support this kind of iterative build-and-refine cycle (with deploys, snapshots, and rollback) so your log can mature without a heavyweight rebuild.
FAQ
What is a product experimentation log website?
A product experimentation log website is a shared, searchable repository for documenting experiments (A/B tests, pricing trials, onboarding changes, feature-flag rollouts, email tests). Each entry captures what you tried, why, what happened, and what you decided next—so learnings don’t get lost in docs, dashboards, or chat threads.
How do we define success for an experiment tracking website?
Start by defining 2–4 measurable outcomes, such as:
- Find relevant past experiments in minutes
- Reduce duplicate tests
- Improve decision quality with consistent metrics and results reporting
Those goals should drive your required fields, workflow strictness, and how advanced your taxonomy/search needs to be.
Who should the site be designed for, and how do we validate their needs?
List your primary audiences and the “30-second question” each needs answered. Common needs include:
- Product: compare outcomes and reuse successful patterns
- Design: understand what changed and why
- Engineering: verify implementation details and guardrails
- Leadership: assess impact without reading every detail
- Support: know what changed and how to explain it
Then design templates and page layout to surface those answers immediately.
Should an experimentation log be internal, public, or mixed-access?
Choose one of three models:
- Internal-only: best for sensitive metrics, user data, and roadmap details
- Public: good for transparency/hiring, but requires strict review and redaction
- Mixed: private full log + curated public subset
If you go mixed, define what’s allowed publicly (e.g., no raw metrics, anonymized segments) and who approves publication to avoid rework later.
What site structure and navigation works best for quick discovery?
Keep top-level navigation simple and predictable, for example:
- Experiments (the repository)
- Playbooks (templates/checklists)
- Metrics (definitions and owners)
- Teams (who’s running what)
Pick one primary browsing dimension (product area, funnel stage, or team), then use filters/tags for everything else.
What fields should every experiment entry include?
Make each experiment entry consistent with a minimum required set:
- Title, Hypothesis, Owner
- Start/End date (or planned dates)
- Status (standardized)
For results, standardize:
- Primary metric (from a shared metric list)
- Impact (direction + magnitude + units)
- Confidence notes (plain-language caveats)
- Supporting evidence (short summary or links)
This turns “notes” into comparable records over time.
What should an experiment detail page template look like?
A practical default order is:
- TL;DR summary (change + audience + outcome)
- Key metadata (status, owner, dates, primary metric, links)
- Hypothesis (testable statement)
- Design (variants, targeting, allocation, guardrails, duration)
- Results (primary first, then secondary/guardrails)
- Decision (ship/iterate/rollback + rationale)
- Learnings & follow-ups
- Appendix (charts, SQL, extra links)
This makes pages scannable while keeping depth available.
How should we set up tagging and taxonomy without creating a mess?
Use a small number of tag groups that reflect how people search, such as:
- Product area
- Hypothesis type
- Primary metric
- Segment
Prevent tag sprawl with a controlled vocabulary (naming rules, ownership for creating new tags, and short tag descriptions). Keep core attributes like status, team/owner, and experiment type as structured fields—not free-text tags.
When is a CMS enough, and when should we build a custom app?
Use a CMS if you mainly need consistent documentation, permissions, and basic tagging with a friendly editor.
Consider a custom app if you need deep integrations (feature flags, analytics, warehouse, tickets), advanced search/saved views, workflow rules (mandatory fields/approvals), or automated results pulls.
Whichever you choose, document the source of truth (CMS vs database/app) to avoid duplicated or conflicting entries.
What search, filters, and saved views make the log actually usable day-to-day?
Start with practical discovery tools:
- Full-text search over titles, summaries, and tags
- Filters for status, date range, owner/team, tags, and primary metric
- Saved views like “Running now,” “Recently concluded,” and “High impact”
In list results, show a short outcomes snippet plus key fields (status, owner, primary metric) so users don’t have to open multiple pages to find the right experiment.