Dec 28, 2025·7 min
Claude Code for performance investigations: a measured workflow
Use Claude Code for performance investigations with a repeatable loop: measure, form a hypothesis, change little, and re-measure before shipping.
Why performance work goes wrong without measurement
Performance bugs invite guesswork. Someone notices a page feels slow or an API times out, and the quickest move is to "clean up" code, add caching, or rewrite a loop. The problem is that "feels slow" isn't a metric, and "cleaner" isn't the same as faster.
Without measurement, teams burn hours changing the wrong thing. The hot path might be in the database, the network, or a single unexpected allocation, while the team polishes code that barely runs. Worse, a change that looks smart can make performance worse: extra logging in a tight loop, a cache that increases memory pressure, or parallel work that creates lock contention.
Guesswork also risks breaking behavior. When you change code to speed it up, you might alter results, error handling, ordering, or retries. If you don't re-check correctness and speed together, you can "win" a benchmark while quietly shipping a bug.
Treat performance like an experiment, not a debate. The loop is simple and repeatable:
- Pick one metric that represents the pain (latency, throughput, CPU, memory, DB time).
- Capture a baseline under the same conditions.
- Change one small thing.
- Measure again and compare.
Many wins are modest: shaving 8% off p95 latency, reducing peak memory by 50 MB, or cutting one database query. Those wins still matter, but only if they're measured, verified, and repeatable.
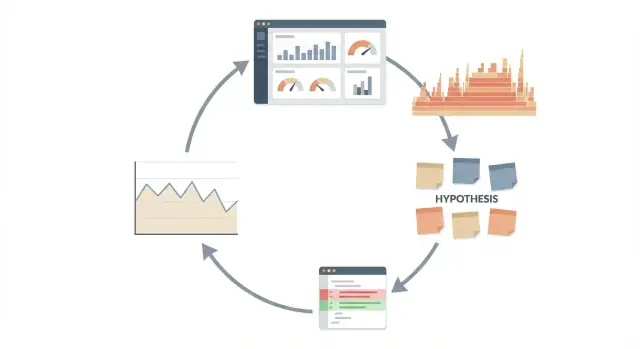
The workflow: measure, hypothesize, change, re-measure
This works best as a loop, not a one-off "make it faster" request. The loop keeps you honest because every action ties back to evidence and a number you can watch.
A clear sequence:
- Measure: pick one metric and record a baseline.
- Hypothesize: explain what you think is slow and why.
- Change: make the smallest possible tweak that tests the hypothesis.
- Re-measure: run the same measurement again and compare.
Each step protects you from a different kind of self-trick. Measuring first stops you from "fixing" something that wasn't a real problem. A written hypothesis stops you from changing five things at once and then guessing which one mattered. Minimal changes reduce the risk of breaking behavior or adding new bottlenecks. Re-measuring catches placebo wins (like a faster run caused by a warm cache) and exposes regressions.
"Done" isn't a feeling. It's a result: the target metric moved in the right direction, and the change didn't cause obvious regressions (errors, higher memory, worse p95 latency, or slower endpoints nearby).
Knowing when to stop is part of the workflow. Stop when gains flatten out, when the metric is already good enough for users, or when the next idea requires major refactors for small upside. Performance work always has opportunity cost; the loop helps you spend time where it pays off.
Choose the metric and lock in a baseline
If you measure five things at once, you won't know what improved. Pick one primary metric for this investigation and treat everything else as supporting signals. For many user-facing problems, that metric is latency. For batch work it might be throughput, CPU time, memory use, or even cloud cost per run.
Be specific about the scenario. "The API is slow" is too vague. "POST /checkout with a typical cart of 3 items" is measurable. Keep inputs stable so the numbers mean something.
Write down the baseline and the environment details before you touch code: dataset size, machine type, build mode, feature flags, concurrency, and warmup. This baseline is your anchor. Without it, every change can look like progress.
For latency, rely on percentiles, not just an average. p50 shows the typical experience, while p95 and p99 expose the painful tail users complain about. A change that improves p50 but worsens p99 can still feel slower.
Decide upfront what "meaningful" means so you don't celebrate noise:
- Latency: at least 10% improvement in p95 (or a fixed threshold like 50 ms)
- Throughput: at least 5% more requests per second at the same error rate
- CPU or memory: enough reduction to avoid scaling or crashes
- Cost: a measurable drop per run or per 1,000 requests
Once these rules are set, you can test ideas without moving the goalposts.
Collect evidence with profiling and simple metrics
Start with the easiest signal you can trust. A single timing around a request can tell you whether you have a real problem, and roughly how big it is. Save deeper profiling for when you need to explain why it's slow.
Good evidence usually comes from a mix of sources:
- App logs (request duration, error rate, slowest endpoints)
- APM traces (where time is spent across services)
- Profiler output or flame graphs (hot functions and call stacks)
- Database stats (slow queries, lock waits, cache hit rate)
- Infrastructure metrics (CPU, memory, network, container restarts)
Use simple metrics when the question is "is it slower, and by how much?" Use profiling when the question is "where is the time going?" If p95 latency doubled after a deploy, start with timings and logs to confirm the regression and scope it. If timings show most of the delay is inside your app code (not the DB), then a CPU profiler or flame graph can point to the exact function that grew.
Keep measurements safe. Collect what you need to debug performance, not user content. Prefer aggregates (durations, counts, sizes) over raw payloads, and redact identifiers by default.
Noise is real, so take multiple samples and note outliers. Run the same request 10 to 30 times, and record median and p95 rather than one best run.
Write down the exact test recipe so you can repeat it after changes: environment, dataset, endpoint, request body size, concurrency level, and how you captured results.
Turn evidence into a clear hypothesis
Start with a symptom you can name: "p95 latency jumps from 220 ms to 900 ms during traffic peaks," "CPU sits at 95% on two cores," or "memory grows by 200 MB per hour." Vague symptoms like "it feels slow" lead to random changes.
Next, translate what you measured into a suspect area. A flame graph might show most time in JSON encoding, a trace might show a slow call path, or database stats might show one query dominating total time. Pick the smallest area that explains most of the cost: a function, a single SQL query, or one external call.
A good hypothesis is one sentence, testable, and tied to a prediction. You're asking for help testing an idea, not asking a tool to magically make everything faster.
A simple hypothesis template
Use this format:
- Because of (evidence), (suspect) is causing (symptom).
- If we change (specific behavior), then (metric) should improve by (rough amount).
- We will know it worked if (re-measurement result).
Example: "Because the profile shows 38% of CPU in SerializeResponse, allocating a new buffer per request is causing CPU spikes. If we reuse a buffer, p95 latency should drop by about 10-20% and CPU should fall by 15% under the same load."
Keep yourself honest by naming alternatives before you touch code. Maybe the slow part is actually an upstream dependency, lock contention, a cache miss rate change, or a rollout that increased payload size.
Write down 2 to 3 alternative explanations, then choose the one your evidence supports best. If your change doesn't move the metric, you already have the next hypothesis ready.
How to use Claude Code without drifting into guesswork
Isolate one hot path
Generate a minimal change behind a flag so you can re-measure safely.
Claude is most useful in performance work when you treat it like a careful analyst, not an oracle. Keep every suggestion tied to what you measured, and make sure each step can be proven wrong.
Give it real inputs, not a vague description. Paste small, focused evidence: a profiling summary, a few log lines around the slow request, a query plan, and the specific code path. Include "before" numbers (p95 latency, CPU time, DB time) so it knows your baseline.
Ask it to explain what the data suggests and what it does not support. Then force competing explanations. A prompt worth using ends with: "Give me 2-3 hypotheses, and for each, tell me what would falsify it." That prevents locking onto the first plausible story.
Before changing anything, ask for the smallest experiment that can validate the leading hypothesis. Keep it quick and reversible: add one timer around a function, enable one profiler flag, or run one DB query with EXPLAIN.
If you want a tight structure for the output, ask for:
- What the evidence indicates (and confidence)
- 2-3 hypotheses with a falsification test
- The smallest code or config change to test the top one
- Exactly what metric to re-measure and the expected direction
If it can't name a specific metric, location, and expected result, you're back to guessing.
Make minimal, reversible changes
After you have evidence and a hypothesis, resist the urge to "clean up everything." Performance work is easiest to trust when the code change is small and easy to undo.
Change one thing at a time. If you tweak a query, add caching, and refactor a loop in the same commit, you won't know what helped (or what hurt). Single-variable changes make the next measurement meaningful.
Before you touch the code, write down what you expect to happen in numbers. Example: "p95 latency should drop from 420 ms to under 300 ms, and DB time should drop by about 100 ms." If the result misses that target, you learn fast that the hypothesis was weak or incomplete.
Keep changes reversible:
- Prefer a small diff that can be reverted cleanly.
- Put the change behind a simple flag so you can turn it off quickly.
- Avoid drive-by refactors that change names, formatting, and logic together.
- Keep the scope tight: one endpoint, one hot path, one expensive call.
- Add a short note in the commit message with the expected before/after metrics.
"Minimal" doesn't mean "trivial." It means focused: cache one expensive function result, remove one repeated allocation in a tight loop, or stop doing work for requests that don't need it.
Add lightweight timing around the suspected bottleneck so you can see what moved. A single timestamp before and after a call (logged or captured as a metric) can confirm whether your change hit the slow part or just shifted time elsewhere.
Re-measure and decide what to do next
Invite a teammate to test
Use referrals to bring others in and run the measure-change loop together.
After a change, re-run the exact same scenario you used for the baseline: same inputs, environment, and load shape. If your test depends on caches or warm-up, make that explicit (for example: "first run cold, next 5 runs warm"). Otherwise you'll "find" improvements that were just luck.
Compare results using the same metric and the same percentiles. Averages can hide pain, so keep an eye on p95 and p99 latency, plus throughput and CPU time. Run enough repetitions to see if the numbers settle.
Before you celebrate, check for regressions that don't show up in one headline number:
- Correctness: responses still match expected output.
- Error rate: timeouts, 5xxs, retries.
- Memory: higher peak or steady growth across runs.
- Tail latency: p99 got worse even if p50 got better.
- Resource cost: CPU or DB load spiked.
Then decide based on evidence, not hope. If the improvement is real and you didn't introduce regressions, keep it. If results are mixed or noisy, revert and form a new hypothesis, or isolate the change further.
If you're working in a platform like Koder.ai, taking a snapshot before experimenting can make rollback a single step, which makes it easier to test bold ideas safely.
Finally, write down what you learned: the baseline, the change, the new numbers, and the conclusion. This short record keeps the next round from repeating the same dead ends.
Common mistakes that waste time
Performance work usually goes sideways when you lose the thread between what you measured and what you changed. Keep a clean chain of evidence so you can say, with confidence, what made things better or worse.
The repeat offenders:
- Fixing the wrong target: you celebrate a faster median (p50), but tail latency (p95 or p99) is still bad.
- Changing a bunch of things at once: refactors, caching, and query tweaks in one commit means you can't tell what helped.
- Believing one noisy run: a local benchmark that swings 20% between runs isn't proof.
- Treating a single profile as the whole truth: a flame graph points at JSON parsing, but requests are piling up during DB slowdowns.
- Comparing apples to oranges: different datasets, feature flags, hardware, or concurrency levels, then drawing conclusions anyway.
A small example: an endpoint looks slow, so you tune the serializer because it's hot in a profile. Then you re-test with a smaller dataset and it looks faster. In production p99 gets worse because the database is still the bottleneck and your change increased payload size.
If you use Claude Code to propose fixes, keep it on a short leash. Ask for 1 to 2 minimal changes that match the evidence you already collected, and insist on a re-measure plan before you accept a patch.
A quick checklist before you call it "faster"
Speed claims fall apart when the test is fuzzy. Before you celebrate, make sure you can explain what you measured, how you measured it, and what you changed.
Start by naming one metric and writing down the baseline result. Include the details that change numbers: machine type, CPU load, dataset size, build mode (debug vs release), feature flags, cache state, and concurrency. If you can't recreate the setup tomorrow, you don't have a baseline.
Checklist:
- Metric and baseline are recorded with environment notes (hardware, config, data, warm or cold cache).
- Test steps are written and repeatable.
- You have one hypothesis with a prediction (for example, "If we remove N+1 queries, p95 latency should drop by ~30%").
- You made one small, reversible change and documented exactly what moved (file, function, query, setting).
- You re-measured with multiple samples and compared like with like (same inputs, same load).
After the numbers look better, do a fast regression pass. Check correctness (same outputs), error rate, and timeouts. Watch side effects like higher memory, CPU spikes, slower startup, or more database load. A change that improves p95 latency but doubles memory might be the wrong trade.
Example: investigating a slow API endpoint step by step
Turn profiling notes into code
Use Koder.ai to draft a focused patch from your metrics and hypothesis.
A team reports that GET /orders feels fine in dev, but slows down in staging once it hits moderate load. Users complain about timeouts, but average latency still looks "okay," which is a classic trap.
First, set a baseline. Under a steady load test (same dataset, same concurrency, same duration), you record:
- p95 latency: 1.8s (target is < 600ms)
- API CPU: ~70% with occasional spikes
- DB: one query is taking 900-1100ms, and total query time per request is ~1.3s
Now gather evidence. A quick trace shows the endpoint runs a main query for orders, then loops and fetches related items per order. You also notice the JSON response is large, but DB time dominates.
Turn that into a hypothesis list you can test:
- A slow query needs an index.
- N+1 queries are multiplying DB time.
- Serialization is slow due to a huge payload.
- Lock contention is stalling reads during writes.
Ask for a minimal change that matches the strongest evidence: remove one obvious N+1 call by fetching items in a single query keyed by order IDs (or add the missing index if the slow query plan shows a full scan). Keep it reversible and in a focused commit.
Re-measure with the same load test. Results:
- p95 latency: 1.8s -> 720ms
- Total DB time: ~1.3s -> 420ms
- CPU: slightly lower, but still spiky
Decision: ship the fix (clear win), then start a second cycle focused on the remaining gap and CPU spikes, since DB is no longer the main limiter.
Next steps: make this workflow routine
The fastest way to get better at performance investigations is to treat each run like a small experiment you can repeat. When the process is consistent, results become easier to trust, compare, and share.
A simple one-page template helps:
- Metric + how it's measured (tool, command, dataset)
- Baseline (numbers, environment, and when captured)
- Hypothesis (one sentence, testable)
- Change (small diff, what you touched)
- Result (before/after, plus decision)
Decide where these notes live so they don't disappear. A shared place matters more than the perfect tool: a repo folder next to the service, a team doc, or ticket notes. The key is discoverability. Someone should be able to find "p95 latency spike after caching change" months later.
Make safe experiments a habit. Use snapshots and easy rollback so you can try an idea without fear. If you're building with Koder.ai, Planning Mode can be a convenient place to outline the measurement plan, define the hypothesis, and keep the change scoped before you generate a tight diff and re-measure.
Set a cadence. Don't wait for incidents. Add small performance checks after changes like new queries, new endpoints, bigger payloads, or dependency upgrades. A 10-minute baseline check now can save a day of guessing later.
FAQ
What’s the first metric I should measure when something “feels slow”?
Start with one number that matches the complaint, usually p95 latency for a specific endpoint and input. Record a baseline under the same conditions (data size, concurrency, warm/cold cache), then change one thing and re-measure.
If you can’t reproduce the baseline, you’re not measuring yet—you’re guessing.
What should I write down for a baseline so it’s actually useful?
A good baseline includes:
- The exact scenario (endpoint, inputs, concurrency)
- The primary metric (for example p95 latency)
- Environment notes (machine/container size, build mode, feature flags)
- Cache state (cold vs warm) and warm-up steps
- Enough samples to see variance (not one “best” run)
Write it down before you touch code so you don’t move the goalposts.
Why does everyone focus on p95/p99 instead of average latency?
Percentiles show the user experience better than an average. p50 is “typical,” but users complain about the slow tail, which is p95/p99.
If p50 improves but p99 gets worse, the system can feel slower even though the average looks better.
When should I use profiling vs simple request timing?
Use simple timings/logs when you’re asking “is it slower and by how much?” Use profiling when you’re asking “where is the time going?”
A practical flow is: confirm the regression with request timings, then profile only after you know the slowdown is real and scoped.
How do I avoid getting lost measuring too many things at once?
Pick one primary metric, and treat the rest as guardrails. A common set is:
- Primary: p95 latency (or throughput)
- Guardrails: error rate, p99 latency, CPU, memory, DB time
This keeps you from “winning” one chart while quietly causing timeouts, memory growth, or worse tail latency.
What does a “good hypothesis” look like in performance work?
Write a one-sentence hypothesis tied to evidence and a prediction:
- Because of (evidence), (suspect) is causing (symptom).
- If we change (specific behavior), then (metric) should improve by (rough amount).
If you can’t name the evidence and the expected metric movement, the hypothesis isn’t testable yet.
Why are minimal, reversible changes so important?
Make it small, focused, and easy to undo:
- Change one thing per commit
- Keep scope to one endpoint/hot path
- Avoid refactors mixed with performance tweaks
- Prefer a flag so you can turn it off
Small diffs make the next measurement meaningful and reduce the chance you break behavior while chasing speed.
After a change, what should I double-check besides “it got faster”?
Re-run the exact same test recipe (same inputs, load, environment, cache rules). Then check for regressions beyond the headline number:
- Correctness (same outputs)
- Error rate/timeouts
- Memory peak and growth
- Tail latency (p99)
- CPU/DB load shifts
If results are noisy, take more samples or revert and tighten the experiment.
How do I use Claude Code without turning it into “optimization by vibe”?
Give it concrete evidence and force it to stay test-driven:
- Paste a small profiling summary/logs/trace and the baseline numbers
- Ask for 2–3 hypotheses and a falsification test for each
- Ask for the smallest experiment to validate the top hypothesis
- Require a re-measure plan (metric, expected direction, conditions)
If the output doesn’t include a specific metric and re-test plan, you’re drifting back into guesswork.
How do I know when to stop optimizing?
Stop when:
- Gains flatten out across repeated measurements
- The metric is “good enough” for users and SLOs
- The next step requires large refactors for small expected upside
Performance work has opportunity cost. The loop (measure → hypothesize → change → re-measure) helps you spend time only where the numbers prove it matters.