Jun 13, 2025·8 min
How to Build a Web App for Centralized Metrics Ownership
Learn a practical blueprint for building a web app that centralizes metric definitions, owners, approvals, and reuse across teams.
What “Centralized Metrics” Means (and Why It Matters)
Centralized metrics means your company has one shared place where business metrics are defined, owned, and explained—so everyone is working from the same playbook. In practice, it’s a metrics catalog (a KPI dictionary) where each metric has a single approved definition, an accountable owner, and clear guidance on how to use it.
The pain: “same metric, different answers”
Without a centralized definition, teams naturally create their own versions of the same KPI. “Active users” might mean “logged in” to Product, “did any event” to Analytics, and “paid subscribers who used a feature” to Finance.
Each version can be reasonable in isolation—but when a dashboard, a quarterly business review, and a billing report disagree, trust erodes fast.
You also get hidden costs: duplicated work, long Slack threads to reconcile numbers, last-minute changes before exec reviews, and a growing pile of tribal knowledge that breaks when people switch roles.
The goal: one source of truth for definitions and ownership
A centralized metrics app creates a single source of truth for:
- Metric definitions (formula, inclusion/exclusion rules, time windows)
- Metric ownership (who maintains it and who approves changes)
- Usage context (where it should be used, and where it shouldn’t)
This is not about forcing one number for every question—it’s about making differences explicit, intentional, and discoverable.
Who benefits (and how)
- Analytics teams stop reinventing metrics and can enforce consistent KPI definitions.
- Product teams ship faster with fewer debates during experiment readouts.
- Finance and Ops get stable reporting for forecasting and planning.
- Leadership gets reliable, comparable KPIs across teams.
Success criteria to aim for
You’ll know centralized metrics governance is working when you see fewer metric disputes, faster reporting cycles, fewer “which definition did you use?” follow-ups, and consistent KPIs across dashboards and meetings—even as the company scales.
Scope and Data Model: What Your App Must Store
Before you design screens or workflows, decide what the app is responsible for remembering. A centralized metrics app fails when definitions live in comments, spreadsheets, or people’s heads. Your data model should make every metric explainable, searchable, and safely changeable.
Core objects (the minimum catalog)
Most teams can cover the majority of use cases with these objects:
- Metric: the KPI itself (e.g., “Monthly Active Users”).
- Dimension: how the metric is sliced (e.g., country, plan, device).
- Source: where the data originates (warehouse table, event stream, CRM).
- Owner: accountable person or team (often linked to a directory user/group).
- Dashboard/Report: where the metric is consumed (BI asset, notebook, slide deck).
- Tag: lightweight classification (e.g., Growth, Finance, North Star, OKR 2026).
These objects make the catalog feel complete: users can jump from a metric to its slices, origin, steward, and where it appears.
Required fields for a Metric record
A metric page should answer: What is it? How is it calculated? When should I use it?
Include fields such as:
- Name (human-friendly) and short description.
- Business definition (plain language).
- Formula / logic (SQL snippet, pseudo-code, or calculation steps).
- Grain (what one row/value represents: user-day, order, account-month).
- Default filters and allowed filters (what’s included/excluded, known caveats).
- Unit (count, %, $, minutes) and aggregation (sum, avg, distinct count).
- Examples (real-world interpretations and common questions it answers).
Governance fields (so changes are controlled)
Even at the data model level, plan for governance:
- Status: draft / approved / deprecated.
- Effective dates: when a definition starts/ends being valid.
- Approvers: user(s) or group(s) required for approval.
- Deprecation reason and replacement metric (if applicable).
Relationships you should model explicitly
Good catalogs are navigable:
- A Metric depends on Sources (tables, events, pipelines) and may rely on specific Dimensions.
- A Dashboard/Report uses Metrics (many-to-many), optionally with a “primary metric” flag.
- Owners relate to both Metrics and Sources (who fixes the pipeline vs. who owns the KPI meaning).
If you get these objects and relationships right, your later UX (catalog browsing, metric pages, templates) becomes straightforward—and your definitions stay consistent as the company grows.
Roles, Responsibilities, and Metric Ownership
A centralized metrics app only works when every metric has a clear “adult in the room.” Ownership answers basic questions quickly: Who guarantees this definition is correct? Who approves changes? Who tells everyone what changed?
Core roles in the app
Metric owner
The accountable person for a metric’s meaning and use. Owners don’t need to write SQL, but they do need authority and context.
Steward / reviewer
A quality gatekeeper who checks that definitions follow standards (naming, units, segmentation rules, allowed filters), and that the metric aligns with existing metrics.
Contributor
Anyone who can propose a new metric or suggest edits (Product Ops, Analytics, Finance, Growth, etc.). Contributors move ideas forward, but they don’t ship changes on their own.
Consumer
The majority of users: people who read, search, and reference metrics in dashboards, docs, and planning.
Admin
Manages the system itself: permissions, role assignment, templates, and high-risk actions like forced ownership reassignment.
Ownership responsibilities (what “owning” actually means)
Owners are responsible for:
- Definition accuracy: business meaning, inclusion/exclusion rules, units, and grain (e.g., user-day vs. account-month).
- Change approvals: reviewing requests, confirming impact, and approving or rejecting updates.
- Communication: ensuring affected teams know about updates (release note, comment thread, or notification).
- Lifecycle hygiene: marking metrics as deprecated when they’re superseded, and pointing to the replacement.
RACI-style workflow expectations
Set expectations directly in the UI so people don’t guess:
- Propose (Contributor): drafts a metric or change request with rationale and examples.
- Review (Steward/Reviewer): checks standards, duplicates, naming, and clarity.
- Approve (Owner): final decision; responsible for downstream impact.
- Archive/Deprecate (Owner + Admin for enforcement): owner initiates; admin can enforce if needed.
Escalation when ownership is missing or disputed
Make “unowned metric” a first-class state. A pragmatic path:
- Auto-suggest owners (based on domain/team tags or who created the metric).
- Time-boxed assignment: if unassigned for X days, notify the relevant team lead.
- Dispute resolution: steward mediates; if unresolved, escalate to a designated data governance lead or department head.
This structure prevents ghost metrics and keeps definitions stable as teams change.
Governance Workflow: Draft, Review, Approve, Deprecate
A centralized metrics app works when it’s clear who can change a metric, how changes are evaluated, and what “approved” actually guarantees. A simple, reliable model is a status-driven workflow with explicit permissions and a visible paper trail.
Statuses: what each one allows
Draft → Review → Approved → Deprecated should be more than labels—each status should control behavior:
- Draft: Anyone with author rights can create or edit. Draft metrics can be incomplete, but the app should still validate basics (name, owner, data source).
- Review: Edits are restricted (or require a new change request). Reviewers can comment, request updates, and run checks. The metric is visible to stakeholders, but clearly marked as not yet authoritative.
- Approved: The definition and query logic are locked (or edits require a formal change request). Approved metrics are eligible for downstream integrations (BI sync, API access) and can be referenced as the source of truth.
- Deprecated: Read-only, clearly flagged, and excluded from templates and “recommended” results. Provide a replacement link and a deprecation reason.
Proposal flow: create/change request with rationale
Treat new metrics and changes as proposals. A proposal should capture:
- What is changing (definition text, filters, grain, SQL/logic, owner, thresholds)
- Why (rationale)
- Who is impacted (teams, dashboards, alerts)
- When it should take effect (optionally with an effective date)
Review checklist to avoid “almost-the-same” KPIs
A consistent checklist keeps reviews fast and fair:
- Definition clarity and business intent
- Filters and inclusions/exclusions (including time windows)
- Grain (per user, per order, per day) and how it aggregates
- Edge cases (refunds, cancellations, missing IDs, late-arriving data)
- Naming standards and consistency with existing metrics
Auditability: who approved what and when
Every transition should be logged: proposer, reviewers, approver, timestamps, and a diff of what changed. This history is what lets you confidently answer: “When did this KPI change, and why?” It also makes rollbacks safer when a definition causes surprises.
App UX: Catalog, Metric Pages, and Templates
Make metric definitions consistent
Create metric pages with required fields, templates, and change requests without starting from scratch.
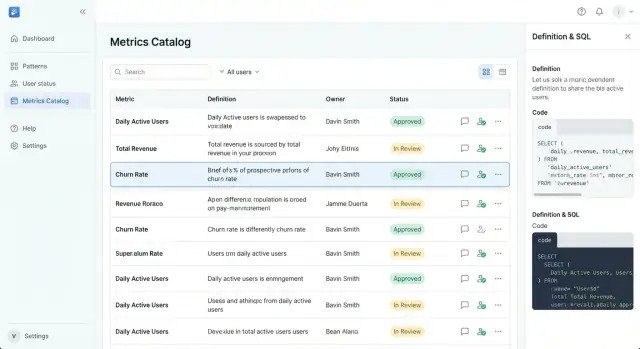
Your app succeeds or fails on whether someone can answer, in under a minute: “Is this metric real, current, and who owns it?” The UX should feel closer to a well-organized product catalog than a data tool.
Catalog: browse, search, filter
Start with a catalog home that supports quick scanning and confident selection.
Make the primary navigation opinionated:
- Browse by domain/team (e.g., Growth, Finance, Support)
- Search with forgiving matching (aliases, common abbreviations)
- Filters that reflect governance: tag, status (Draft/Approved/Deprecated), owner, and data source
Each metric card/row should show the minimum decision set: metric name, short definition, status badge, owner, and last updated date. This prevents users from clicking into multiple pages just to figure out whether a metric is usable.
Metric detail page: everything you need, nothing you don’t
A metric page should be readable top-to-bottom like a spec sheet:
- Plain-language definition (one paragraph) plus why it matters
- Owner and backup owner, with a clear “Ask a question” action
- Business rules (what’s included/excluded), granularity, and refresh cadence
- Sample query (optional) and a link to the canonical dataset
- Usage: dashboards, reports, and teams that depend on it
- Change history: what changed, when, and why
Keep technical content collapsible (“Show SQL / calculation details”) so non-technical users aren’t forced to parse it.
Templates that guide good definitions
Templates reduce inconsistency. Use required fields (name, definition, owner, status, domain, numerator/denominator or formula) and provide suggested wording like “Count of…” or “Percentage of…”. Pre-fill examples to prevent blank, vague entries.
UX for non-technical users
Write for clarity: avoid acronyms in titles, support synonyms (“Active Users” vs. “DAU”), and show tooltips for unavoidable jargon. Always pair a metric with a human owner—people trust people more than tables.
Access Control: Auth, Permissions, and Admin Controls
If a metrics app is where definitions become official, access control can’t be an afterthought. You’re not just protecting data—you’re protecting decisions: what counts as Revenue, who can change it, and when.
Authentication: pick what fits your org
Start with a clear login approach and keep it consistent across the product:
- SSO/OAuth (recommended for larger teams): Works well with Google/Microsoft/Okta so employees use existing accounts and offboarding is automatic.
- Email + password: Fine for smaller companies or mixed external users, but add basics like email verification and reset flows.
Whichever you choose, make identity stable: users should have a unique ID even if their email changes.
Authorization: RBAC plus ownership
Use role-based access control (RBAC) for broad permissions, and add resource-level ownership for precision.
A simple model:
- Viewer: read-only access to the catalog
- Editor: create drafts, propose changes
- Approver (Steward): approve definitions within assigned domains
- Admin: manage org settings, roles, domains, and policies
Then layer in ownership rules like “Only the metric owner (or domain approver) can edit the approved definition.” This prevents drive-by edits while still enabling collaboration.
Protect key actions with extra friction
Some actions should require stronger checks because they alter trust:
- Approvals and publishing (who can make a metric official)
- Deprecations and deletions (avoid breaking dashboards)
- Permission and ownership changes (stop privilege escalation)
Practical safeguards: confirmation dialogs with clear impact text, required reasons for changes, and (for sensitive actions) re-authentication or admin approval.
Admin controls: where governance becomes manageable
Add an admin area that supports real operations:
- Teams and domains (e.g., Sales, Finance, Product)
- Role assignment and ownership transfer
- Policy settings (naming rules, required fields, approval requirements)
Even if your first release is small, designing these controls early prevents messy exceptions later—and makes metrics governance feel predictable instead of political.
Versioning, History, and Safe Changes
When a metric changes, confusion spreads faster than the update. A centralized metrics app should treat every definition like a product release: versioned, reviewable, and easy to roll back (at least conceptually) if something goes wrong.
Version every meaningful change
Create a new version whenever anything that could affect interpretation changes—definition text, calculation logic, included/excluded data, ownership, thresholds, or even the display name. “Minor edit” and “major edit” can exist, but both should be captured as versions so people can answer: Which definition did we use when we made that decision?
A practical rule: if a stakeholder might ask “did this metric change?”, it deserves a new version.
A changelog people can actually read
Each metric page should include a clear timeline that shows:
- What changed (before/after summary, not just raw text)
- Why it changed (the business reason)
- Who approved it (name + role)
- When it happened (timestamp, and whether it’s future-dated)
Approvals should be linked to the exact version they authorized.
Effective dating for real-world transitions
Many metrics need definitions that change at a specific point in time (new pricing, new product packaging, a revised policy). Support effective dates so the app can show:
- Current definition
- Upcoming definition (effective Jan 1)
- Past definitions
This avoids retroactively rewriting history and helps analysts align reporting periods correctly.
Deprecation without breaking trust
Deprecation should be explicit, not silent. When a metric is deprecated:
- Mark it as Deprecated with a short reason
- Redirect to a replacement metric (or list alternatives)
- Show a persistent UI warning on the metric page and in search results
Done well, deprecation reduces duplicate KPIs while preserving context for old dashboards and past decisions.
Integrations: BI, Warehouse, Notifications, and APIs
Iterate safely
Use snapshots and rollback so changes to workflows and permissions are easy to reverse.
A centralized metrics app only becomes the source of truth when it fits into how people already work: dashboards in BI, queries in the warehouse, and approvals in chat. Integrations turn definitions into something teams can trust and reuse.
BI tool traceability (dashboards → metrics)
Your metric page should answer a simple question: “Where is this number used?” Add a BI integration that lets users link a metric to dashboards, reports, or specific tiles.
This creates two-way traceability:
- From a metric page: see all dashboards that rely on it (with relative links like
/bi/dashboards/123if you proxy or store internal references). - From a dashboard: show the metric definition it uses (owner, formula, filters, grain, and current status).
The practical win is faster audits and fewer debates: when a dashboard looks off, people can verify the definition rather than re-litigating it.
Warehouse integration (example SQL + table/model references)
Most metric disagreements start in the query. Make the warehouse connection explicit:
- Store example SQL for the metric (the reference query people can compare against).
- Store references to the underlying tables/models (e.g., warehouse tables, dbt models, or semantic-layer entities).
- Optionally store known caveats like late-arriving data or timezone rules.
You don’t need to execute queries in your app at first. Even static SQL plus lineage gives reviewers something concrete to validate.
Slack/Teams notifications for governance events
Routing governance through email slows everything down. Post event notifications to Slack/Teams for:
- Review requested
- Approved / rejected
- Deprecation scheduled
- Breaking change detected (e.g., a definition change that affects linked dashboards)
Include a deep link back to the metric page and the specific action needed (review, approve, comment).
API + webhooks for automation
An API lets other systems treat metrics as a product, not a document. Prioritize endpoints for search, read, and status:
- List/search metrics, owners, and tags
- Fetch the current approved definition and its version
- Create review requests and add comments
Add webhooks so tools can react in real time (e.g., trigger a BI annotation when a metric is deprecated). Document these at /docs/api, and keep payloads stable so automations don’t break.
Together, these integrations reduce tribal knowledge and keep metric ownership visible wherever decisions happen.
Definition Standards and Quality Checks
A metrics app only works when definitions are consistent enough that two people reading the same metric arrive at the same interpretation. Standards and quality checks turn “a page with a formula” into something teams can trust and reuse.
Definition standards to enforce
Start by standardizing the fields every metric must have:
- Name and short description: use a consistent naming pattern (for example, “Revenue (Net)” vs. “Revenue”).
- Unit and formatting: currency, percentage, count, or duration. Include rounding rules (e.g., 2 decimals) and display conventions.
- Time window: clearly state the default grain and lookback (daily/weekly/monthly, trailing 7 days, MTD, etc.).
- Default filters: what’s included/excluded by default (region, product line, channel). Defaults should be explicit so dashboards don’t silently drift.
Make these fields required in your metric template, not “recommended.” If a metric can’t meet the standard, it’s not ready to publish.
Edge cases you should document
Most disagreements happen at the edges. Add a dedicated “Edge cases” section with prompts for:
- Nulls and missing records: are nulls treated as zero, excluded, or flagged?
- Late-arriving data: what changes after the fact, and for how long should the metric be considered provisional?
- Refunds/cancellations/chargebacks: do they adjust historical periods or only the current period?
- De-duplication and identity rules: what counts as a unique user/order?
Validation fields and known limits
Add structured validation fields so users know when a metric is healthy:
- Data freshness expectation (e.g., updated hourly, daily by 9am)
- Source tables / systems of record
- Known limitations (coverage gaps, backfills, sampling)
A “Definition Quality” checklist
Before approval, require a checklist like:
- Name, unit, time window, and default filters completed
- Formula or logic documented (and reviewed)
- Edge cases filled out
- Freshness expectation set
- Owner assigned and contact path clear
The app should block submission or approval until all required items pass, turning quality from a guideline into a workflow.
Adoption: Make the Catalog the Default Place to Look
Pilot centralized metrics fast
Start on the free tier and validate your workflow with a pilot domain like Revenue or Growth.
A metrics catalog only works when it becomes the first stop for “What does this number mean?” Adoption is a product problem, not just a governance problem: you need clear value for everyday users, low-friction paths to contribute, and visible responsiveness from owners.
Measure adoption like a product
Instrument simple signals that tell you whether people are actually relying on the catalog:
- Searches performed (and “no results” rate)
- Metric page views and top entry points (search vs. links)
- Approvals completed and average time to approve
- Re-use: which metrics get linked in dashboards, docs, and tickets
Use these signals to prioritize improvements. For example, a high “no results” rate often means inconsistent naming or missing synonyms—fixable with better templates and curation.
Build feedback loops into every metric page
People trust definitions more when they can ask questions in context. Add lightweight feedback where confusion happens:
- Comments/questions thread for each metric
- “Suggest an edit” flow that creates a change request (instead of editing in place)
- Quick reactions like “This answered my question” to gauge helpfulness
Route feedback to the metric owner and steward, and show status (“triaged,” “in review,” “approved”) so users see progress rather than silence.
Onboard users with two short paths
Adoption stalls when users don’t know how to contribute safely. Provide two prominent guides and link them from the empty state and the navigation:
- How to add a metric: when to create a new one, required fields, examples
- How to request changes: when to open a change request, what evidence to include
Keep these as living pages (e.g., /docs/adding-a-metric and /docs/requesting-changes).
Create a predictable weekly cadence
Set a weekly review meeting (30 minutes is enough) with owners and stewards to:
- Clear pending approvals
- Triage new questions and suggested edits
- Identify duplicates and merge candidates
Consistency is the adoption flywheel: fast answers build trust, and trust drives repeat use.
Security, Compliance Basics, and Rollout Plan
Security for a metrics ownership app isn’t only about preventing breaches—it’s also about keeping the catalog trustworthy and safe for everyday sharing. The key is being clear about what belongs in the system, what doesn’t, and how changes are recorded.
Data classification: store definitions, not sensitive data
Treat the app as a source of truth for meaning, not a repository of raw facts.
Store safely:
- Metric names, descriptions, formulas, and inclusion/exclusion rules
- Ownership, review cadence, and links to dashboards (e.g.,
/dashboards/revenue) - Data sources at a high level (e.g., “orders table”) without copying data
Avoid storing:
- Row-level customer data, emails, device IDs, or support tickets
- Query result exports, screenshots with personal data, or sample datasets
- Secrets (API keys), warehouse credentials, or private tokens
When teams want examples, use synthetic examples (“Order A, Order B”) or aggregate examples (“last week’s total”) with clear labels.
Logging and retention: audit without oversharing
You’ll want an audit trail for compliance and accountability, but logs can accidentally become a data leak.
Log:
- Who changed what and when (diffs of definitions, status changes, approvals)
- Permission changes and admin actions
Don’t log:
- Full request payloads that might include pasted data
- Access tokens or credentials
Set retention by policy (for example, 90–180 days for standard logs; longer for audit events) and separate audit events from debug logs so you can keep the former without keeping everything.
Backups and reliability basics
Minimum expectations:
- Automated daily backups of the database (plus point-in-time recovery if possible)
- Regular restore tests (a backup you haven’t restored is a hope, not a plan)
- Clear RPO/RTO targets (how much you can lose, how fast you must recover)
Rollout plan: start small, then scale
Begin with a pilot domain (e.g., Revenue or Acquisition) and 1–2 teams. Define success metrics such as “% of dashboards linked to approved metrics” or “time to approve a new KPI.” Iterate on friction points, then expand domain by domain with lightweight training and a clear expectation: if it’s not in the catalog, it’s not an official metric.
Building the app faster (a practical note)
If you’re turning this into a real internal tool, the fastest path is usually to ship a thin but complete version—catalog browsing, metric pages, RBAC, and an approval workflow—then iterate.
Teams often use Koder.ai to get that first version live quickly: you can describe the app in chat, use Planning Mode to lock the scope, and generate a working stack (React on the frontend; Go + PostgreSQL on the backend). From there, snapshots and rollback help you iterate safely, and source code export keeps you unblocked if you want to take the codebase into your existing engineering pipeline. Deployment/hosting and custom domains are useful for internal rollouts, and the free/pro/business/enterprise tiers make it easy to start small and scale governance as adoption grows.
FAQ
What does “centralized metrics” mean in practice?
Centralized metrics means there’s one shared, approved place to define KPIs—typically a metrics catalog/KPI dictionary—so teams don’t maintain conflicting versions.
Practically, each metric has:
- A single definition (business meaning + calculation rules)
- A named owner and approver
- Clear guidance on when to use (and not use) the metric
How do I know if we have a “same metric, different answers” problem?
Start by inventorying the KPIs that appear in exec reviews, finance reporting, and top dashboards, then compare definitions side-by-side.
Common red flags:
- Same name, different filters/time windows/grain
- People ask “which definition did you use?” after sharing a number
- Dashboards disagree with finance or billing reports
- Metrics live in spreadsheets, Slack threads, or tribal knowledge
What’s the minimum data model a metrics ownership app should store?
Most teams get strong coverage with these objects:
- Metric (the KPI)
- Dimension (how it’s sliced)
- (tables/events/systems of record)
What should every metric detail page include to be useful?
Aim for fields that answer: What is it? How is it calculated? When should I use it?
A practical “required” set:
- Name + short description
- Business definition (plain language)
- Formula/logic (SQL or pseudocode)
- Grain (e.g., user-day, account-month)
- Unit + aggregation rule
What governance workflow works best for metric creation and changes?
Use a status-driven workflow that controls what’s editable and what’s “official”:
- Draft: flexible editing; validate basics (name/owner/source)
- Review: feedback and checks; restrict direct edits
- Approved: definition is locked; changes require a formal request
- Deprecated: read-only; show reason + replacement
Also store a proposal record capturing .
Who should own a metric, and what are they responsible for?
Define clear roles and tie them to permissions:
- Owner: accountable for meaning/usage; approves changes; communicates updates
- Steward/Reviewer: enforces standards; catches duplicates and inconsistencies
- Contributor: proposes new metrics/edits via change requests
How should a metrics app handle versioning and effective dates?
Version whenever a change could alter interpretation (definition, logic, filters, grain, thresholds, even renames).
Include a readable changelog:
- Before/after summary
- Business rationale
- Approver + timestamp
Support effective dates so you can show current, upcoming, and past definitions without rewriting history.
What permission model prevents drive-by edits while staying collaborative?
Use RBAC + resource-level ownership:
- Viewer: read-only
- Editor: create drafts, propose changes
- Approver/Steward: approve within domains
- Admin: manage org settings and policies
Add extra friction for trust-sensitive actions (publish/approve, deprecate/delete, change ownership/permissions) using confirmation prompts and required reasons.
Which integrations make a metrics catalog actually get used?
Start with integrations that reduce real day-to-day friction:
- BI traceability: link metrics ↔ dashboards/tiles so users can see where a number is used
- Warehouse references: store example SQL and source table/model links (no need to execute queries initially)
- Notifications: Slack/Teams alerts for review requests, approvals, and deprecations
- API + webhooks: read/search metrics, fetch approved definitions/versions, create review requests; document at /docs/api
How do we roll this out safely and drive adoption across the company?
Treat adoption as a product rollout:
- Pilot one domain (e.g., Revenue) and a couple teams
- Instrument usage (searches, no-result rate, page views, approval time)
- Add feedback loops (comments, “suggest an edit” → change request)
For security, store definitions and metadata, not raw customer data or secrets. Keep audit logs for changes/approvals, set retention policies, and ensure backups + restore tests are in place.