May 21, 2025·8 min
Create a Web App for Centralized Client SLA Reporting
Learn how to plan, build, and launch a multi-client web app that collects SLA data, normalizes metrics, and delivers dashboards, alerts, and exportable reports.
Learn how to plan, build, and launch a multi-client web app that collects SLA data, normalizes metrics, and delivers dashboards, alerts, and exportable reports.
Centralized SLA reporting exists because SLA evidence rarely lives in one place. Uptime may sit in a monitoring tool, incidents in a status page, tickets in a helpdesk, and escalation notes in email or chat. When each client has a slightly different stack (or different naming conventions), monthly reporting turns into manual spreadsheet work—and disagreements about “what really happened” become common.
A good SLA reporting web app serves multiple audiences with different goals:
The app should present the same underlying truth at different levels of detail, depending on the role.
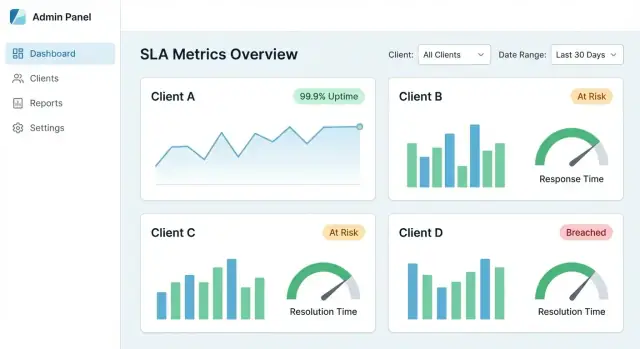
A centralized SLA dashboard should deliver:
In practice, every SLA number should be traceable to raw events (alerts, tickets, incident timelines) with timestamps and ownership.
Before building anything, define what is in scope and out of scope. For example:
Clear boundaries prevent debates later and keep reporting consistent across clients.
At minimum, centralized SLA reporting should support five workflows:
Design around these workflows from day one and the rest of the system (data model, integrations, and UX) stays aligned with real reporting needs.
Before you build screens or pipelines, decide what your app will measure and how those numbers should be interpreted. The goal is consistency: two people reading the same report should reach the same conclusion.
Start with a small set that most clients recognize:
Be explicit about what each metric measures and what it doesn’t. A short definitions panel in the UI (and a link to /help/sla-definitions) prevents misunderstandings later.
Rules are where SLA reporting usually breaks. Document them in sentences your client could validate, then translate them into logic.
Cover the essentials:
Choose default periods (monthly and quarterly are common) and whether you’ll support custom ranges. Clarify the time zone used for cutoffs.
For breaches, define:
For each metric, list the required inputs (monitoring events, incident records, ticket timestamps, maintenance windows). This becomes your blueprint for integrations and data quality checks.
Before you design dashboards or KPIs, get clear on where SLA evidence actually lives. Most teams discover their “SLA data” is split across tools, owned by different groups, and recorded with slightly different meanings.
Start with a simple list per client (and per service):
For each system, note the owner, retention period, API limits, time resolution (seconds vs minutes), and whether data is client-scoped or shared.
Most SLA reporting web apps use a combination:
A practical rule: use webhooks where freshness matters, and API pulls where completeness matters.
Different tools describe the same thing in different ways. Normalize into a small set of events your app can rely on, such as:
incident_opened / incident_closeddowntime_started / downtime_endedticket_created / first_response / resolvedInclude consistent fields: client_id, service_id, source_system, external_id, severity, and timestamps.
Store all timestamps in UTC, and convert on display based on the client’s preferred time zone (especially for monthly reporting cutoffs).
Plan for gaps too: some clients won’t have status pages, some services won’t be monitored 24/7, and some tools may lose events. Make “partial coverage” visible in reports (e.g., “monitoring data unavailable for 3 hours”) so SLA results aren’t misleading.
If your app reports SLAs for multiple customers, architecture decisions determine whether you can scale safely without cross-client data leaks.
Start by naming the layers you need to support. A “client” might be:
Write these down early, because they affect permissions, filters, and how you store configuration.
Most SLA reporting apps pick one of these:
tenant_id. It’s cost-effective and simpler to operate, but requires strict query discipline.A common compromise is shared DB for most tenants and dedicated DBs for “enterprise” customers.
Isolation must hold across:
tenant_id so results can’t be written to the wrong tenantUse guardrails such as row-level security, mandatory query scopes, and automated tests for tenant boundaries.
Different clients will have different targets and definitions. Plan for per-tenant settings like:
Internal users often need to “impersonate” a client view. Implement a deliberate switch (not a free-form filter), display the active tenant prominently, log switches for audit, and prevent links that could bypass tenant checks.
A centralized SLA reporting web app lives or dies on its data model. If you model only “SLA % per month,” you’ll struggle to explain results, handle disputes, or update calculations later. If you model only raw events, reporting becomes slow and expensive. The goal is to support both: traceable raw evidence and fast, client-ready rollups.
Keep a clean separation between who is being reported on, what is being measured, and how it’s calculated:
Design tables (or collections) for:
SLA logic changes: business hours update, exclusions get clarified, rounding rules evolve. Add a calculation_version (and ideally a “rule set” reference) to every computed result. That way, old reports can be reproduced exactly even after improvements.
Include audit fields where they matter:
Clients often ask “show me why.” Plan a schema for evidence:
This structure keeps the app explainable, reproducible, and fast—without losing the underlying proof.
If your inputs are messy, your SLA dashboard will be too. A reliable pipeline turns incident and ticket data from multiple tools into consistent, auditable SLA results—without double-counting, gaps, or silent failures.
Treat ingestion, normalization, and rollups as separate stages. Run them as background jobs so the UI stays fast and you can retry safely.
This separation also helps when one client’s source is down: ingestion can fail without corrupting existing calculations.
External APIs time out. Webhooks can be delivered twice. Your pipeline must be idempotent: processing the same input more than once should not change the outcome.
Common approaches:
Across clients and tools, “P1,” “Critical,” and “Urgent” might all mean the same priority—or not. Build a normalization layer that standardizes:
Store both the original value and the normalized value for traceability.
Add validation rules (missing timestamps, negative durations, impossible status transitions). Don’t drop bad data silently—route it into a quarantine queue with a reason and a “fix or map” workflow.
For each client and source, compute “last successful sync,” “oldest unprocessed event,” and “rollup up-to date through.” Display this as a simple data freshness indicator so clients trust the numbers and your team spots issues early.
If clients use your portal to review SLA performance, authentication and permissions need to be designed as carefully as the SLA math. The goal is simple: every user sees only what they should—and you can prove it later.
Start with a small, clear set of roles and expand only when you have strong reasons:
Keep least privilege as the default: new accounts should land in viewer mode unless explicitly promoted.
For internal teams, SSO reduces account sprawl and offboarding risk. Support OIDC (common with Google Workspace/Azure AD/Okta) and, where required, SAML.
For clients, offer SSO as an upgrade path, but still allow email/password with MFA for smaller organizations.
Enforce tenant boundaries at every layer:
Log access to sensitive pages and downloads: who accessed what, when, and from where. This helps with compliance and client trust.
Build an onboarding flow where admins or client editors can invite users, set roles, require email verification, and revoke access instantly when someone leaves.
A centralized SLA dashboard succeeds when a client can answer three questions in under a minute: Are we meeting SLAs? What changed? What caused the misses? Your UX should guide them from a high-level view to evidence—without forcing them to learn your internal data model.
Start with a small set of tiles and charts that match common SLA conversations:
Make each card clickable so it becomes a doorway to details, not a dead end.
Filters should be consistent across all pages and “stick” as users navigate.
Recommended defaults:
Show active filter chips at the top so users always understand what they’re viewing.
Every metric should have a path to “why.” A strong drill-down flow:
If a number can’t be explained with evidence, it will be questioned—especially during QBRs.
Add tooltips or an “info” panel for every KPI: how it’s calculated, exclusions, time zone, and data freshness. Include examples like “Maintenance windows excluded” or “Uptime measured at the API gateway.”
Make filtered views shareable via stable URLs (e.g., /reports/sla?client=acme&service=api&range=30d). This turns your centralized SLA dashboard into a client-ready reporting portal that supports recurring check-ins and audit trails.
A centralized SLA dashboard is useful day-to-day, but clients often want something they can forward internally: a PDF for leadership, a CSV for analysts, and a link they can bookmark.
Support three outputs from the same underlying SLA results:
For link-based reports, make filters explicit (date range, service, severity) so the client knows exactly what the numbers represent.
Add scheduling so each client can receive reports automatically—weekly, monthly, and quarterly—sent to a client-specific list or a shared inbox. Keep schedules tenant-scoped and auditable (who created it, last sent time, next run).
If you need a simple starting point, launch with a “monthly summary” plus a one-click download from /reports.
Build templates that read like QBR/MBR slides in written form:
Real SLAs include exceptions (maintenance windows, third-party outages). Let users attach compliance notes and flag exceptions that require approval, with an approval trail.
Exports must respect tenant isolation and role permissions. A user should only export the clients, services, and time periods they’re allowed to view—and the export should match the portal view exactly (no extra columns leaking hidden data).
Alerts are where an SLA reporting web app turns from “interesting dashboard” into an operational tool. The goal isn’t to send more messages—it’s to help the right people react early, document what happened, and keep clients informed.
Start with three categories:
Tie each alert to a clear definition (metric, time window, threshold, client scope) so recipients can trust it.
Offer multiple delivery options so teams can meet clients where they already work:
For multi-client reporting, route notifications using tenant rules (e.g., “Client A breaches go to Channel A; internal breaches go to on-call”). Avoid sending client-specific details to shared channels.
Alert fatigue will kill adoption. Implement:
Each alert should support:
This creates a lightweight audit trail you can reuse in client-ready summaries.
Provide a basic rules editor for per-client thresholds and routing (without exposing complex query logic). Guardrails help: defaults, validation, and preview (“this rule would have triggered 3 times last month”).
A centralized SLA reporting web app quickly becomes mission-critical because clients use it to judge service quality. That makes speed, safety, and evidence (for audits) as important as the charts themselves.
Large clients can generate millions of tickets, incidents, and monitoring events. To keep pages responsive:
Raw events are valuable for investigations, but keeping everything forever increases cost and risk.
Set clear rules such as:
For any client reporting portal, assume sensitive content: customer names, timestamps, ticket notes, and sometimes PII.
Even if you’re not aiming for a specific standard, good operational evidence builds trust.
Maintain:
Launching an SLA reporting web app is less about a big-bang release and more about proving accuracy, then scaling repeatably. A strong launch plan reduces disputes by making results easy to verify and easy to reproduce.
Pick one client with a manageable set of services and data sources. Run your app’s SLA calculations in parallel with their existing spreadsheets, ticket exports, or vendor portal reports.
Focus on common mismatch areas:
Document differences and decide whether the app should match the client’s current approach or replace it with a clearer standard.
Create a repeatable onboarding checklist so each new client experience is predictable:
A checklist also helps you estimate effort and support discussions on /pricing.
SLA dashboards are only credible if they’re fresh and complete. Add monitoring for:
Send internal alerts first; once stable, you can introduce client-visible status notes.
Collect feedback on where confusion happens: definitions, disputes (“why is this a breach?”), and “what changed” since last month. Prioritize small UX improvements like tooltips, change logs, and clear footnotes on exclusions.
If you want to ship an internal MVP quickly (tenant model, integrations, dashboards, exports) without spending weeks on boilerplate, a vibe-coding approach can help. For example, Koder.ai lets teams draft and iterate on a multi-tenant web app via chat—then export the source code and deploy. That’s a practical fit for SLA reporting products, where the core complexity is domain rules and data normalization rather than one-off UI scaffolding.
You can use Koder.ai’s planning mode to outline entities (tenants, services, SLA definitions, events, rollups), then generate a React UI and a Go/PostgreSQL backend foundation you can extend with your specific integrations and calculation logic.
Keep a living doc with next steps: new integrations, export formats, and audit trails. Link to related guides on /blog so clients and teammates can self-serve details.
Centralized SLA reporting should create one source of truth by pulling uptime, incidents, and ticket timelines into a single, traceable view.
Practically, it should:
Start with a small set most clients recognize, then expand only when you can explain and audit them.
Common starting metrics:
For each metric, document what it measures, what it excludes, and the data sources required.
Write rules in plain language first, then convert them into logic.
You typically need to define:
If two people can’t agree on the sentence version, the code version will be disputed later.
Store all timestamps in UTC, then convert for display using the tenant’s reporting time zone.
Also decide upfront:
Be explicit in the UI (e.g., “Reporting period cutoffs are in America/New_York”).
Use a mix of integration methods based on freshness vs completeness:
A practical rule: use webhooks where freshness matters, API pulls where completeness matters.
Define a small canonical set of normalized events so different tools map to the same concepts.
Examples:
incident_opened / incident_closedPick a multi-tenancy model and enforce isolation beyond the UI.
Key protections:
tenant_idAssume exports and background jobs are the easiest places to accidentally leak data if you don’t design for tenant context.
Store both raw events and derived results so you can be fast and explainable.
A practical split:
Make the pipeline staged and idempotent:
For reliability:
Include three alert categories so the system is operational, not just a dashboard:
Reduce noise with deduplication, quiet hours, and escalation, and make each alert actionable with acknowledgment and resolution notes.
downtime_started / downtime_endedticket_created / first_response / resolvedInclude consistent fields like tenant_id, service_id, source_system, external_id, severity, and UTC timestamps.
Add a calculation_version so past reports can be reproduced exactly after rule changes.