Nov 15, 2025·8 min
Create a Web App for Inventory Forecasting & Demand Planning
Plan and build a web app for inventory forecasting and demand planning: data setup, forecasting methods, UX, integrations, testing, and deployment.
What You’re Building and Why It Matters
An inventory forecasting and demand planning web app helps a business decide what to buy, when to buy it, and how much to buy—based on expected future demand and current inventory position.
Inventory forecasting predicts sales or consumption for each SKU over time. Demand planning turns those predictions into decisions: reorder points, order quantities, and timing that align with service goals and cash constraints.
The problems it solves
Without a reliable system, teams often rely on spreadsheets and gut feel. That typically leads to two costly outcomes:
- Stockouts (lost sales, rushed shipping, unhappy customers)
- Excess stock (cash tied up, storage costs, markdowns, obsolescence)
A well-designed inventory forecasting web app creates a shared source of truth for demand expectations and recommended actions—so decisions stay consistent across locations, channels, and teams.
Start simple, then improve
Accuracy and trust are built over time. Your MVP demand planning app can start with:
- A small set of core SKUs
- A simple weekly forecast
- Basic reorder recommendations
Once users adopt the workflow, you can steadily improve accuracy with better data, segmentation, promotions handling, and smarter models. The goal isn’t a “perfect” forecast—it’s a repeatable decision process that gets better every cycle.
Who uses it
Typical users include:
- Demand/inventory planners: create plans and review exceptions
- Operations and warehouse teams: prepare receiving and allocation
- Purchasing/procurement: place orders and manage suppliers
- Finance: understand inventory investment and working capital
The outcome to optimize
Judge the app by business results: fewer stockouts, lower excess inventory, and clearer purchasing decisions—all visible in an inventory planning dashboard that makes the next action obvious.
Scope the MVP: Decisions, Horizon, and Granularity
An inventory forecasting web app succeeds or fails on clarity: what decisions will it support, for whom, and at what level of detail? Before models and charts, define the smallest set of decisions your MVP must improve.
1) Start with the business questions
Write them as actions, not features:
- How much to order for each item (suggested quantity)
- When to order (order date or reorder trigger)
- Where to order for (which SKU, which location or channel)
If you can’t tie a screen to one of these questions, it likely belongs in a later phase.
2) Set a planning horizon and cadence
Pick a horizon that matches lead times and buying rhythm:
- Weeks (e.g., 4–12) for fast-moving SKUs or short lead times
- Months (e.g., 3–6) for imported goods or seasonal planning
Then choose the cadence for updates: daily if sales change quickly, weekly if purchasing happens on set cycles. Your cadence also determines how often the app runs jobs and refreshes recommendations.
3) Choose the granularity you can operate
The “right” level is the level people can actually buy and move inventory:
- SKU-location (most actionable, most data-hungry)
- SKU only (good for single-warehouse setups)
- Category or channel (useful for early MVPs or sparse data)
4) Define success metrics
Make success measurable: service level / stockout rate, inventory turns, and forecast error (e.g., MAPE or WAPE). Tie metrics to business outcomes like stockout prevention and reduced overstock.
5) MVP scope vs. later phases
MVP: one forecast per SKU(-location), one reorder point calculation, a simple approve/export workflow.
Later: multi-echelon inventory optimization, supplier constraints, promotions, and scenario planning.
Identify Data Sources and Data Quality Needs
Forecasts are only as useful as the inputs behind them. Before choosing models or building screens, get clear on what data you have, where it lives, and what “good enough” quality means for an MVP.
Core inputs you’ll need
At minimum, inventory forecasting needs a consistent view of:
- Sales/orders history (by SKU, location, date)
- Inventory on hand and inventory position (on hand + inbound − reserved)
- Receipts and purchase orders (what arrived, what’s expected, and when)
- Lead times (supplier, lane, warehouse processing)
- Calendars (holidays, promotions, store closures, seasonality markers)
Where the data usually lives
Most teams pull from a mix of systems:
- ERP for POs, suppliers, item master, costs
- WMS for receipts, put-away, transfers, inventory adjustments
- POS/eCommerce for demand signals (orders, cancellations)
- Spreadsheets for “tribal knowledge” (overrides, minimums, pack sizes)
Update frequency and late changes
Decide how often the app refreshes (hourly, daily) and what happens when data arrives late or is edited. A practical pattern is to keep immutable transaction history and apply adjustment records rather than overwriting yesterday’s numbers.
Ownership and a simple data dictionary
Assign an owner for each dataset (e.g., inventory: warehouse ops; lead times: procurement). Maintain a short data dictionary: field meaning, units, timezone, and allowed values.
Common gaps to plan for
Expect issues like missing lead times, unit conversions (each vs. case), returns and cancellations, duplicate SKUs, and inconsistent location codes. Flag them early so your MVP can either fix, default, or exclude them—explicitly and visibly.
Design the Data Model for Forecasting and Inventory
A forecasting app succeeds or fails on whether everyone trusts the numbers. That trust starts with a data model that makes “what happened” (sales, receipts, transfers) unambiguous, and makes “what is true right now” (on-hand, on-order) consistent.
Start with the core entities
Define a small set of entities and stick to them across the whole app:
- SKU (product) and SKU attributes (category, pack size, shelf life)
- Location (warehouse, store, 3PL node)
- Supplier (lead times, minimum order quantities)
- Customer/channel (e.g., retail, wholesale, marketplace)
- Time (your chosen calendar at a fixed grain)
Pick a single time grain and align everything
Choose daily or weekly as your canonical time grain. Then force every input to match it: orders might be timestamped, inventory counts might be end-of-day, and invoices might post later. Make your alignment rule explicit (e.g., “sales belong to the ship date, bucketed to day”).
Standardize units and money early
If you sell in each/case/kg, store both the original unit and a normalized unit for forecasting (e.g., “each”). If you forecast revenue, keep original currency plus a normalized reporting currency with an exchange-rate reference.
Model inventory as events (so it’s explainable)
Track inventory as a sequence of events per SKU-location-time: on-hand snapshots, on-order, receipts, transfers, and adjustments. This makes stockout explanations and audit trails far easier.
Define the “single source of truth” per field
For every key metric (unit sales, on-hand, lead time), decide one authoritative source and document it in the schema. When two systems disagree, your model should show which one wins—and why.
Build the Data Pipeline (ETL) You Can Trust
A forecasting UI is only as good as the data feeding it. If numbers change without explanation, users stop trusting the inventory planning dashboard—even when the model is fine. Your ETL should make data predictable, debuggable, and traceable.
Plan the pipeline: extract → clean → aggregate → load → validate
Start by writing down the “source of truth” for each field (orders, shipments, on-hand, lead times). Then implement a repeatable flow:
- Extract from APIs, databases, or flat files with immutable run IDs
- Clean (types, timezones, SKU/location keys, unit conversions)
- Aggregate to the grain your app needs (daily/weekly by SKU-location)
- Load into analytics tables your forecasting jobs will read
- Validate with automated checks before anything reaches dashboards
Store raw vs. curated tables (so issues are traceable)
Keep two layers:
- Raw tables: “as received,” append-only. If an upstream system changes a value, you can see when and why.
- Curated tables: standardized columns and business logic (e.g., net sales, available stock).
When a planner asks, “Why did last week’s demand change?”, you should be able to point to the raw record and the transform that touched it.
Automated checks that catch problems early
At minimum, validate:
- Missing values in dates, SKU IDs, location IDs
- Negative stock or impossible inventory movements
- Outliers (e.g., sudden 10× sales spikes) and duplicate transactions
Fail the run (or quarantine the affected partition) rather than silently publishing bad data.
Batch vs. near-real-time: follow the planning cadence
If purchasing runs weekly, a daily batch is usually enough. Use near-real-time only when operational decisions depend on it (same-day replenishment, rapid e-commerce swings), because it increases complexity and alert noise.
Retry rules, alerts, and run logs
Document what happens on failure: which steps retry automatically, how many times, and who gets notified. Send alerts when extracts break, row counts drop sharply, or validations fail—and keep a run log so you can audit every forecast input.
Choose Forecasting Methods That Fit Your Reality
Make Approvals Auditable
Add roles and audit logs so planners, approvers, and admins can work with confidence.
Forecasting methods aren’t “better” in the abstract—they’re better for your data, SKUs, and planning rhythm. A great web app makes it easy to start simple, measure results, then graduate to advanced models where they actually pay off.
Start with baselines (and keep them forever)
Baselines are fast, explainable, and excellent sanity checks. Include at least:
- Moving average (good for stable items)
- Seasonal naïve (repeat last week/month/season)
- Simple exponential smoothing (reacts to recent shifts without overfitting)
Always report forecast accuracy versus these baselines—if a complex model can’t beat them, it shouldn’t be in production.
Add smarter options later—behind measurement
Once the MVP is stable, add a few “step-up” models:
- Prophet-style seasonality for weekly/annual patterns and holidays
- ARIMA where autocorrelation is strong and history is long enough
- Gradient boosting when you have useful drivers (price, promos, lead time, channel signals)
One model for many SKUs vs. per-SKU selection
You can ship faster with one default model and a small set of parameters. But you’ll often get better results with per-SKU model selection (choose the best model family based on backtests), especially when your catalog mixes steady sellers, seasonal items, and long-tail products.
Don’t ignore intermittent demand
If many SKUs have lots of zeros, treat that as a first-class case. Add methods suited for intermittent demand (e.g., Croston-style approaches) and evaluate with metrics that don’t punish zeros unfairly.
Human-in-the-loop overrides
Planners will need overrides for launches, promotions, and known disruptions. Build an override workflow with reasons, expiry dates, and an audit trail, so manual edits improve decisions without hiding what happened.
Feature Engineering and Edge Cases (Stockouts, New SKUs)
Forecasting accuracy often rises or falls on features: the extra context you provide beyond “sales last week.” The goal isn’t to add hundreds of signals—it’s to add a small set that reflects how your business behaves and that planners can understand.
Calendar and event signals
Demand usually has a rhythm. Add a few calendar features that capture that rhythm without overfitting:
- Weekday and week-of-month (helps with payday effects and weekend spikes)
- Month/season (captures broad seasonality)
- Holidays and local events (binary flags or a small “holiday type” category)
- Promotions (start/end dates, promo depth, channel)
If promotions are messy, start with a simple “on promo” flag and refine later.
Product and supply-side signals
Inventory forecasting is not just demand—it’s also availability. Useful, explainable signals include price changes, lead time updates, and whether a supplier is constrained. Consider adding:
- Current price and “price change vs last period”
- Lead time (and lead time change)
- Minimum order quantity / case pack (if it affects ordering behavior)
- Stock status (in stock, low stock, backorder)
Stockouts: don’t teach the model the wrong lesson
A stockout day with zero sales does not mean zero demand. If you feed those zeros directly, the model learns that demand vanished.
Common approaches:
- Flag stockout periods and exclude them from training targets
- Impute “lost sales” using recent non-stockout demand, or cap demand at available inventory
- Track “days out of stock” as a feature so the model can adjust expectations
Cold-start SKUs and substitutions
New items won’t have history. Define clear rules:
- Forecast from the closest parent level (category/brand) and allocate by planned distribution
- Use similar-item mapping (substitutes, predecessor SKUs) for early weeks
- Gradually shift weight from proxy signals to the SKU’s own history as data accumulates
Keep the feature set small and name features in business terms inside the app (e.g., “Holiday week” not “x_reg_17”) so planners can trust—and challenge—what the model is doing.
Turn Forecasts into Purchase and Replenishment Recommendations
A forecast is only useful when it tells someone what to do next. Your web app should convert predicted demand into specific, reviewable purchasing actions: when to reorder, how much to buy, and how much buffer to carry.
From forecast to reorder point, safety stock, and order quantity
Start with three outputs per SKU (or SKU-location):
- Reorder point (ROP): the inventory position where a new order should be triggered
- Safety stock: extra units to protect against demand and lead-time surprises
- Order quantity: what the buyer should place today (or on the next buying cycle)
A practical structure is:
- Expected demand during lead time (based on your forecast)
-
- safety stock (based on variability and your target service level)
- = reorder point
If you can measure it, include lead time variability (not just average lead time). Even a simple standard deviation per supplier can noticeably reduce stockouts.
Set service levels by business value, not gut feel
Not every item deserves the same protection. Let users choose service level targets by ABC class, margin, or criticality:
- High-margin or mission-critical SKUs: higher service level → more safety stock
- Long-tail or low-impact SKUs: lower service level → leaner inventory
Respect real-world constraints
Recommendations must be feasible. Add constraint handling for:
- MOQ and pack size (round up to case quantities)
- Budget caps (prioritize items with the highest expected impact)
- Capacity limits (warehouse space, pallet positions)
Make the “why” explicit
Every suggested purchase should include a short explanation: forecasted demand over lead time, current inventory position, chosen service level, and the constraint adjustments applied. This builds trust and makes exceptions easy to approve.
Web App Architecture: UI, API, Jobs, and Storage
Get Data In Cleanly
Start with CSV uploads and validations, then evolve to ERP and WMS integrations.
A forecasting app is easiest to maintain when you treat it as two products: a web experience for people, and a forecasting engine that runs in the background. That separation keeps the UI fast, prevents timeouts, and makes results reproducible.
A simple, scalable baseline
Start with four building blocks:
- Web UI for uploading data, configuring runs, viewing forecasts, and approving recommendations
- API (backend service) that validates requests, reads/writes data, and triggers jobs
- Database for transactional data (runs, settings, users, approvals) plus a place for larger artifacts
- Background jobs for heavy work: feature generation, model training, forecasting, and recommendation calculation
The key decision: forecasting runs should never execute inside a UI request. Put them on a queue (or scheduled jobs), return a run ID, and stream progress in the UI.
If you want to accelerate the MVP build, a vibe-coding platform like Koder.ai can be a practical fit for this architecture: you can prototype a React-based UI, a Go API with PostgreSQL, and background-job workflows from a single chat-driven build loop—then export the source code when you’re ready to harden or self-host.
Storage: what goes where
Keep “system of record” tables (tenants, SKUs, locations, run configs, run status, approvals) in your primary database. Store bulk outputs—per-day forecasts, diagnostics, and exports—in tables optimized for analytics or in object storage, then reference them by run ID.
Multi-tenant from day one (even for an MVP)
If you serve multiple business units or clients, enforce tenant boundaries in the API layer and database schema. A simple approach is tenant_id on every table, plus role-based access in the UI. Even a single-tenant MVP benefits from this because it prevents accidental data mixing later.
Define the minimum APIs
Aim for a small, clear surface area:
POST /data/upload(or connectors),GET /data/validationPOST /forecast-runs(start),GET /forecast-runs/:id(status)GET /forecasts?run_id=...andGET /recommendations?run_id=...POST /approvals(accept/override),GET /audit-logs
Keeping costs predictable
Forecasting can get expensive. Limit heavy retrains by caching features, reusing models when configs don’t change, and scheduling full retrains (e.g., weekly) while running lightweight daily updates. This keeps the UI responsive and your budget stable.
UX and Dashboards: Make Forecasts Usable
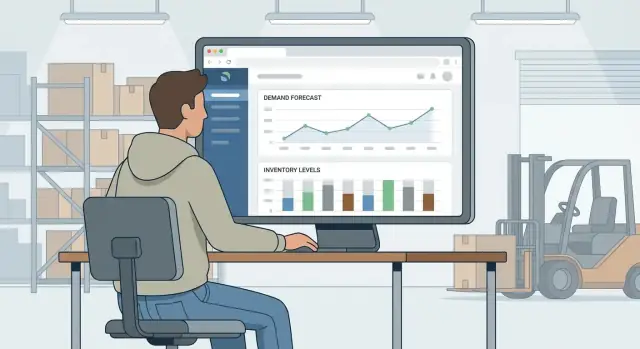
A forecasting model is only valuable if planners can act on it quickly and confidently. Good UX turns “numbers in a table” into clear decisions: what to buy, when to buy it, and what needs attention right now.
Core screens that match real workflows
Start with a small set of screens that map to daily planning tasks:
- Overview: KPIs (service level, stockout risk, weeks of cover), top exceptions, and today’s recommended actions
- SKU detail: one place to understand a single item—history, forecast, on-hand, inbound, lead time, and the resulting reorder recommendation
- Exceptions: a queue of “needs review” items (likely stockout, excess, forecast error spike, supplier delay)
- Order proposals: draft purchase orders with quantities, expected arrival dates, and budget totals
Keep navigation consistent so users can jump from an exception to the SKU detail and back without losing context.
Fast filters and usable performance
Planners slice data constantly. Make filtering instant and predictable for date range, location, supplier, and category. Use sensible defaults (e.g., last 13 weeks, primary warehouse) and remember the user’s last selections.
Explainability people can understand
Build trust by showing why a forecast changed:
- Top demand drivers (promotions, channel mix, price changes)
- A simple seasonality view (weekly pattern, holidays)
- Flags for recent anomalies (one-time bulk order, data gaps)
Avoid heavy math in the UI; focus on plain-language cues and tooltips.
Collaboration and accountability
Add lightweight collaboration: inline notes, an approval step for high-impact orders, and change history (who changed the forecast override, when, and why). This supports auditability without slowing down routine decisions.
Exports and print-ready order views
Even modern teams still share files. Provide clean CSV exports and a print-friendly order summary (items, quantities, supplier, totals, requested delivery date) so purchasing can execute without reformatting.
Integrations, Permissions, and Auditability
Turn Decisions Into Screens
Generate a React UI, Go API, and PostgreSQL schema from your planning workflow.
Forecasts are only as useful as the systems they can update—and the people who can trust them. Plan integrations, access control, and an audit trail early so your app can move from “interesting” to “operational.”
Integrate with ERP/WMS (the operational truth)
Start with the core objects that drive inventory decisions:
- Item master (SKU, UOM, lead time defaults, supplier, status)
- Purchase orders (open/closed, quantities, promised dates)
- Receipts (what actually arrived, when, and where)
- Transfers (inter-warehouse movement, in-transit inventory)
Be explicit about which system is the source of truth for each field. For example, SKU status and UOM from ERP, but forecast overrides from your app.
Support multiple import options
Most teams need a path that works now and a path that scales later:
- API integration for near-real-time sync and fewer manual steps
- SFTP drops for vendors/legacy ERPs that export files nightly
- Scheduled CSV uploads for an MVP, with templates and validation
Whichever route you choose, store import logs (row counts, errors, timestamps) so users can diagnose missing data without engineering help.
Identity, roles, and approvals
Define permissions around how your business operates—typically by location and/or department. Common roles include Viewer, Planner, Approver, and Admin. Make sure sensitive actions (editing parameters, approving POs) require the right role.
Audit trail that people can rely on
Record who changed what, when, and why: forecast overrides, reorder point edits, lead time adjustments, and approval decisions. Keep diffs, comments, and links to affected recommendations.
If you publish forecast KPIs, link definitions in-app (or reference /blog/forecast-accuracy-metrics). For rollout planning, a simple tiered access model can align with /pricing.
Testing, Backtesting, and Measuring Forecast Quality
A forecasting app is only useful if you can prove it performs well—and if you can spot when it stops performing well. Testing here isn’t just “does the code run,” but “do the forecasts and recommendations improve outcomes?”
Pick metrics that match business decisions
Start with a small set of metrics that everyone can understand:
- MAE (average absolute error) for “how far off are we, in units?”
- MAPE/WMAPE for “how far off are we, relative to sales volume?” (WMAPE is usually more stable across SKUs)
- Bias to detect systematic over-forecasting or under-forecasting
- Service-level impact (fill rate, stockout rate) to connect accuracy to customer experience and revenue
Report these by SKU, category, location, and forecast horizon (next week vs. next month can behave very differently).
Backtest with realistic time splits
Backtesting should mirror how the app will run in production:
- Train on a historical window, then test on the following weeks/months (no random shuffling)
- Repeat across multiple rolling periods to avoid “lucky” test windows
- Compare against simple baselines (last week, moving average). If you can’t beat these reliably, don’t ship complexity.
Guardrails and monitoring
Add alerts when accuracy suddenly drops, or when inputs look wrong (missing sales, duplicated orders, unusual spikes). A small monitoring panel in your /admin area can prevent weeks of bad purchasing decisions.
Pilot recommendations and close the loop
Before full rollout, run a pilot with a small group of planners/buyers. Track whether recommendations were accepted or rejected, plus the reason. That feedback becomes training data for rule tweaks, exceptions, and better defaults.
Security, Privacy, and Operational Readiness
Forecasting apps often touch the most sensitive parts of a business: sales history, supplier pricing, inventory positions, and upcoming purchase plans. Treat security and operations as product features—because one leaked export or a broken nightly job can undo months of trust.
Access control: keep permissions boring and strict
Protect sensitive business data with least-privilege access. Start with roles like Viewer, Planner, Approver, and Admin, then gate actions (not just pages): viewing costs, editing parameters, approving purchase recommendations, and exporting data.
If you integrate with an identity provider (SSO), map groups to roles so offboarding is automatic.
Encryption and secrets hygiene
Encrypt data in transit and at rest where possible. Use HTTPS everywhere, rotate API keys, and store secrets in a managed vault rather than environment files on servers. For databases, enable at-rest encryption and restrict network access to only your app and job runners.
Auditability: make “who did what” easy to answer
Log access and critical actions (exports, edits, approvals). Keep structured logs for:
- Data imports and their source files
- Forecast runs (method, parameters, code version)
- Recommendation edits/overrides and approvals
This isn’t bureaucracy—it’s how you debug surprises in an inventory planning dashboard.
Retention, backups, and incident response
Define retention rules for uploads and historical runs. Many teams keep raw uploads briefly (e.g., 30–90 days) and keep aggregated results longer for trend analysis.
Prepare an incident response and backup plan: who is on call, how to revoke access, and how to restore the database. Test restores on a schedule, and document recovery time objectives for the API, jobs, and storage so your demand planning software remains dependable under stress.
FAQ
What is the first thing to define when building an inventory forecasting and demand planning web app?
Start by defining the decisions it must improve: how much to order, when to order, and where to order for (SKU, location, channel). Then choose a practical planning horizon (e.g., 4–12 weeks) and a single time grain (daily or weekly) that matches how the business buys and replenishes.
What should an MVP include for an inventory forecasting web app?
A solid MVP usually includes:
- One forecast per SKU (or SKU-location) at a weekly or daily grain
- Basic reorder recommendations (ROP, safety stock, order quantity)
- An exceptions list (stockout risk, excess risk)
- An approve/export workflow (CSV or draft PO view)
Keep everything else (promotions, scenario planning, multi-echelon optimization) for later phases.
What data do I need to produce useful forecasts and replenishment recommendations?
At minimum, you need:
- Sales/orders history by SKU, location, and date
- Inventory position (on hand + inbound − reserved)
- Purchase orders and receipts (expected vs actual arrivals)
- (and ideally lead time variability)
How do I handle data quality issues without killing the project?
Create a data dictionary and enforce consistency in:
- SKU and location IDs (no duplicates, stable keys)
- Time alignment (what date a sale “belongs” to)
- Units of measure (each vs case vs kg), with a normalized unit
- Returns/cancellations rules (net vs gross demand)
In the pipeline, add automated checks for missing keys, negative stock, duplicates, and outliers—and quarantine bad partitions instead of publishing them.
How should I model inventory data so users trust the numbers?
Treat inventory as a set of events and snapshots:
- Transactions: sales, receipts, transfers, adjustments
- State: on-hand snapshots, on-order quantities, reserved quantities
This makes “what happened” auditable and keeps “what is true now” consistent. It also makes it easier to explain stockouts and reconcile disagreements between ERP, WMS, and POS/eCommerce sources.
Which forecasting methods should I use first?
Start with simple, explainable baselines and keep them forever:
- Moving average
- Seasonal naïve (repeat last week/month)
- Exponential smoothing
Use backtests to prove any advanced model beats those baselines. Add more complex methods only when you can measure improvement (and when you have enough clean history and drivers).
How do I avoid forecasting mistakes caused by stockouts?
Don’t feed stockout zeros directly into the training target. Common approaches:
- Flag and exclude stockout periods from training
- Impute lost sales using recent non-stockout demand
- Track days out of stock as a feature
The key is to avoid teaching the model that demand disappeared when the real issue was availability.
How do I forecast demand for new SKUs with little or no history?
Use explicit cold-start rules, such as:
- Forecast at a parent level (category/brand) and allocate down
- Map to a similar or predecessor SKU for early weeks
- Gradually shift weight from proxy signals to the SKU’s own history as data accumulates
Make these rules visible in the UI so planners know when a forecast is proxy-based vs data-driven.
How do I turn forecasts into reorder points and purchase quantities?
Convert forecasts into three actionable outputs:
- Expected demand during lead time
- Safety stock (based on variability and service level target)
- Reorder point and a suggested order quantity
Then apply real-world constraints like MOQ and case packs (rounding), budget caps (prioritization), and capacity limits (space/pallets). Always show the “why” behind each recommendation.
What architecture works best for a forecasting web app (UI, API, jobs, storage)?
Separate the UI from the forecasting engine:
- UI and API handle configuration, validation, approvals, and retrieval
- Background jobs handle feature generation, training, forecasting, and recommendations
Never run a forecast inside a UI request—use a queue or scheduler, return a run ID, and show progress/status in the app. Store bulk outputs (forecasts, diagnostics) in analytics-friendly storage referenced by run ID.