Oct 05, 2025·8 min
Create a Real-Time Web App to Monitor and Prevent SLA Breaches
Learn a practical blueprint for building a web app that tracks SLA timers, detects breaches instantly, alerts teams, and visualizes compliance in real time.
Learn a practical blueprint for building a web app that tracks SLA timers, detects breaches instantly, alerts teams, and visualizes compliance in real time.
Before you design screens or write detection logic, get crisp on what your app is trying to prevent. “SLA monitoring” can mean anything from a daily report to second-by-second breach prediction—those are very different products with very different architectural needs.
Start by agreeing on the reaction window your team can realistically execute.
If your support org operates in 5–10 minute cycles (triage queues, paging rotations), then “real time” might mean dashboard updates every minute with alerts within 2 minutes. If you’re handling high-severity incidents where minutes matter, you may need a 10–30 second detection-and-alert loop.
Write this down as a measurable goal, such as: “Detect potential breaches within 60 seconds and notify the on-call within 2 minutes.” This becomes a guardrail for later tradeoffs in architecture and cost.
List the specific promises you’re tracking, and define each in plain language:
Also note how these relate to SLO and SLA definitions in your org. If your internal SLO differs from the customer-facing SLA, your app may need to track both: one for operational improvement, one for contractual risk.
Name the groups who will use or rely on the system: support, engineering, customer success, team leads/managers, and incident response/on-call.
For each group, capture what they need to decide in the moment: “Is this ticket at risk?”, “Who owns it?”, “Do we need escalation?” This will shape your dashboard, alert routing, and permissions.
Your goal isn’t only visibility—it’s timely action. Decide what should happen when risk rises or a breach occurs:
A good outcome statement: “Reduce SLA breaches by enabling breach detection and incident response within our agreed reaction window.”
Before you build detection logic, write down exactly what “good” and “bad” look like for your service. Most SLA monitoring problems aren’t technical—they’re definition problems.
An SLA (Service Level Agreement) is a promise to customers, usually with consequences (credits, penalties, contract terms). An SLO (Service Level Objective) is an internal target you aim for to stay safely above the SLA. A KPI (Key Performance Indicator) is any metric you track (helpful, but not always tied to a promise).
Example: SLA = “respond within 1 hour.” SLO = “respond within 30 minutes.” KPI = “average first response time.”
List each breach type you need to detect and the event that starts the timer.
Common breach categories:
Be explicit about what counts as “response” (public reply vs internal note) and “resolution” (resolved vs closed), and whether reopening resets the timer.
Many SLAs only count time during business hours. Define the calendar: working days, holidays, start/end times, and the time zone used for calculation (customer’s, contract’s, or team’s). Also decide what happens when work crosses boundaries (e.g., a ticket arrives at 16:55 with a 30-minute response SLA).
Document when the SLA clock stops, such as:
Write these as rules your app can apply consistently, and keep examples of tricky cases for later testing.
Your SLA monitor is only as good as the data feeding it. Start by identifying the “systems of record” for each SLA clock. For many teams, the ticketing tool is the source of truth for lifecycle timestamps, while monitoring and logging tools explain why something happened.
Most real-time SLA setups pull from a small set of core systems:
If two systems disagree, decide upfront which one wins for each field (for example: “ticket status from ServiceNow, customer tier from CRM”).
At minimum, track events that start, stop, or change the SLA timer:
Also consider operational events: business hours calendar changes, customer timezone updates, and holiday schedule changes.
Prefer webhooks for near-real-time updates. Use polling when webhooks aren’t available or reliable. Keep API exports/backfills for reconciliation (for example, nightly jobs that fill gaps). Many teams end up with a hybrid: webhook for speed, periodic polling for safety.
Real systems are messy. Expect:
Treat these as product requirements, not “edge cases”—your breach detection depends on getting them right.
A good SLA monitoring app is easier to build (and maintain) when the architecture is clear and intentionally simple. At a high level, you’re building a pipeline that turns raw operational signals into “SLA state,” then uses that state to alert people and power a dashboard.
Think in five blocks:
This separation keeps responsibilities clean: ingestion shouldn’t contain SLA logic, and dashboards shouldn’t run heavy calculations.
Decide early how “real-time” you truly need to be.
A pragmatic approach is to start with frequent recalculation for one or two SLA rules, then move high-impact rules to streaming.
Avoid multi-region and multi-environment complexity at first. A single region, one production environment, and a minimal staging setup are usually enough until you validate data quality and alert usefulness. Make “scale later” a design constraint, not a build requirement.
If you want to accelerate the first working version of the dashboard and workflows, a vibe-coding platform like Koder.ai can help you scaffold a React-based UI and a Go + PostgreSQL backend quickly from a chat-driven spec, then iterate on screens and filters as you validate what responders actually need.
Write these down before you implement:
Event ingestion is where your SLA monitoring system either becomes dependable—or noisy and confusing. The goal is simple: accept events from many tools, convert them into a single “truthy” format, and store enough context to explain every SLA decision later.
Start by standardizing what an “SLA-relevant event” looks like, even if upstream systems vary. A practical baseline schema includes:
ticket_id (or case/work item ID)timestamp (when the change happened, not when you received it)status (opened, assigned, waiting_on_customer, resolved, etc.)priority (P1–P4 or equivalent)customer (account/tenant identifier)sla_plan (which SLA rules apply)Version the schema (e.g., schema_version) so you can evolve fields without breaking older producers.
Different systems name the same thing differently: “Solved” vs “Resolved,” “Urgent” vs “P1,” timezone differences, or missing priorities. Build a small normalization layer that:
is_customer_wait or is_pause) that make breach logic simpler laterReal integrations retry. Your ingestion must be idempotent so repeated events don’t create duplicates. Common approaches:
event_id and reject duplicatesticket_id + timestamp + status) and upsertWhen someone asks “Why did we alert?” you need a paper trail. Store every accepted raw event and every normalized event, plus who/what changed it. This audit history is essential for customer conversations and internal reviews.
Some events will fail parsing or validation. Don’t drop them silently. Route them to a dead-letter queue/table with the error reason, original payload, and retry count, so you can fix mappings and replay safely.
Your SLA app needs two different “memories”: what’s true right now (to trigger alerts) and what happened over time (to explain and prove why it alerted).
Current state is the latest known status of each work item (ticket/incident/order) plus its active SLA timers (start time, paused time, due time, remaining minutes, current owner).
Choose a store optimized for quick reads/writes by ID and simple filtering. Common options are a relational database (Postgres/MySQL) or a key-value store (Redis/DynamoDB). For many teams, Postgres is enough and keeps reporting simple.
Keep the state model small and query-friendly. You’ll read it constantly for views like “breaching soon.”
History should capture every change as an immutable record: created, assigned, priority changed, status updated, customer replied, on-hold started/ended, etc.
An append-only event table (or event store) makes audits and replay possible. If you later discover a bug in breach logic, you can reprocess events to rebuild state and compare results.
Practical pattern: state table + events table in the same database at first; graduate to separate analytics storage later if volume grows.
Define retention by purpose:
Use partitions (by month/quarter) to make archival and deletes predictable.
Plan for the questions your dashboard will ask most:
due_at and status (and possibly queue/team).breached_at (or computed breach flag) and date.(customer_id, due_at).This is where performance is won: structure storage around your top 3–5 views, not every possible report.
Real-time breach detection is mostly about one thing: turning messy, human workflows (assigned, waiting on customer, reopened, transferred) into clear SLA timers you can trust.
Start by defining which events control the SLA clock for each ticket or request type. Common patterns:
From these events, calculate a due time. For strict SLAs, it may be “created_at + 2 hours.” For business-hours SLAs, it’s “2 business hours,” which requires a calendar.
Create a small calendar module that answers two questions consistently:
Keep holidays, working hours, and time zones in one place so every SLA rule uses the same logic.
Once you have a due time, computing time remaining is straightforward: due_time - now (in business minutes if applicable). Then define breach risk thresholds such as “due within 15 minutes” or “less than 10% of SLA remaining.” This powers urgency badges and alert routing.
You can:
A practical hybrid is event-driven updates for accuracy, plus a minute-level tick to catch time-based threshold crossings even when no new events arrive.
Alerts are where your SLA monitoring becomes operational. The goal isn’t “more notifications”—it’s getting the right person to take the right action before a deadline is missed.
Use a small set of alert types with clear intent:
Map each type to a different urgency and delivery channel (chat for warnings, paging for confirmed breaches, etc.).
Routing should be data-driven, not hard-coded. Use a simple rules table like: service → owning team, then apply modifiers:
This avoids “broadcast to everyone” and makes ownership visible.
SLA status can flip quickly during incident response. Deduplicate by a stable key such as (ticket_id, sla_rule_id, alert_type) and apply:
Also consider bundling multiple warnings into a single periodic summary.
Each notification should answer “what, when, who, now what”:
If someone can’t act within 30 seconds of reading it, the alert needs better context.
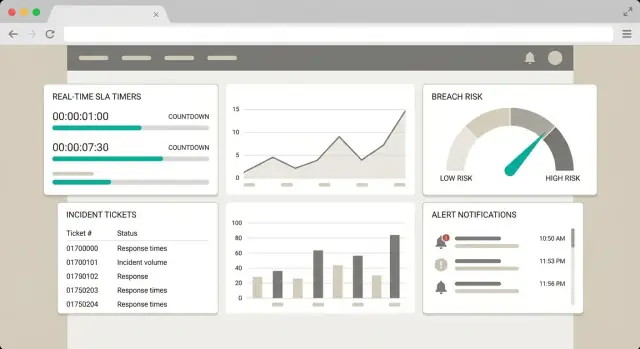
A good SLA dashboard is less about charts and more about helping someone decide what to do next in under a minute. Design the UI around three questions: What’s at risk? Why? What action should I take?
Start with four simple views, each with a clear purpose:
Keep the default view focused on breaching soon, since that’s where prevention happens.
Give users a small set of filters that map to real ownership and triage decisions:
Make filters sticky per user so they don’t reconfigure every visit.
Every row in “breaching soon” should include a short, plain-English explanation, for example:
Add a “Details” drawer that shows the timeline of SLA state changes (started, paused, resumed, breached), so the user can trust the calculation without doing math.
Design the default workflow as: review → open → act → confirm.
Each item should have action buttons that jump to the source of truth:
If you support quick actions (assign, change priority, add note), show them only where you can apply them consistently and audit the change.
A real-time SLA monitoring app quickly becomes a system of record for performance, incidents, and customer impact. Treat it like production-grade software from day one: limit who can do what, protect customer data, and document how data is stored and removed.
Start with a small, clear permission model and expand only when needed. A common setup is:
Keep permissions aligned with workflows. For example, an operator may update incident status, but only an admin can change SLA timers or escalation rules.
SLA monitoring often includes customer identifiers, contract tiers, and ticket content. Minimize exposure:
Integrations (ticketing, chat, metrics, incident tools) are a frequent weak point:
Define policies before you accumulate months of history:
Write these rules down and reflect them in the UI so the team knows what the system keeps—and for how long.
Testing an SLA monitoring app is less about “does the UI load” and more about “are timers, pauses, and thresholds calculated exactly the way your contract expects—every time.” A small mistake (time zones, business hours, missing events) can create noisy alerts or, worse, missed breaches.
Turn your SLA rules into concrete scenarios you can simulate end-to-end. Include normal flows and uncomfortable edge cases:
Prove your breach detection logic is stable under real operational messiness, not just clean demo data.
Create replayable event fixtures: a small library of “incident timelines” you can rerun through ingestion and calculation whenever you change logic. This helps verify calculations over time and prevents regressions.
Keep fixtures versioned (in Git) and include expected outputs: computed remaining time, breach moment, pause windows, and alert triggers.
Treat the SLA monitor like any production system and add its own health signals:
If your dashboard shows “green” while events are stuck, you’ll lose trust quickly.
Write a short, clear runbook for common failure modes: stuck consumers, schema changes, upstream outages, and backfills. Include steps to safely replay events and recalculate timers (what period, what tenants, and how to avoid double-alerting). Link it from your internal docs hub or a simple page like /runbooks/sla-monitoring.
Shipping an SLA monitoring app is easiest when you treat it like a product, not a one-time project. Start with a minimum viable release that proves the end-to-end loop: ingest → evaluate → alert → confirm it helped someone act.
Pick one data source, one SLA type, and basic alerts. For example, monitor “first response time” using a single ticketing system feed, and send an alert when the clock is about to expire (not only after it breaches). This keeps scope tight while validating the tricky parts: timestamps, time windows, and ownership.
Once the MVP is stable, expand in small steps: add a second SLA type (e.g., resolution), then add a second data source, then add richer workflows.
Set up dev, staging, and production early. Staging should mirror production configurations (integrations, schedules, escalation paths) without notifying real responders.
Use feature flags to roll out:
If you’re building fast with a platform like Koder.ai, snapshots and rollback are useful here: you can ship UI and rule changes to a pilot, then revert quickly if alerts get noisy.
Write short, practical setup docs: “Connect data source,” “Create an SLA,” “Test an alert,” “What to do when you get notified.” Keep them near the product, like an internal page at /docs/sla-monitoring.
After initial adoption, prioritize improvements that increase trust and reduce noise:
Iterate based on real incidents: every alert should teach you what to automate, clarify, or remove.
An SLA monitoring goal is a measurable statement that defines:
Write it as an objective you can test: “Detect potential breaches within X seconds and notify on-call within Y minutes.”
Define “real time” based on your team’s ability to respond, not on what’s technically possible.
The key is to commit to an (event → calculation → alert/dashboard), then design around it.
Track the customer-facing promises you can actually breach (and potentially owe credits for), commonly:
Many teams also track an internal that’s stricter than the SLA. If you have both, store and display both so operators can act early while still reporting contractual compliance accurately.
SLA failures are often definition failures. Clarify:
Then encode these as deterministic rules and keep a library of example timelines to test them.
Define a single, consistent calendar rule set:
Implement a reusable calendar module that can answer:
Pick a “system of record” per field and document what wins when systems disagree.
Typical sources:
For near-real-time behavior, prefer ; add for reconciliation and missed events.
At minimum, capture events that start, stop, or modify the SLA clock:
Also plan for "people forget" events like business calendar updates, timezone changes, and holiday schedule changes—these can change due times without any ticket activity.
Use a simple five-block pipeline:
Use both, depending on urgency:
A strong hybrid is: event-driven updates for correctness plus a minute-level tick to catch threshold crossings even when no new events arrive (e.g., “due in 15 minutes”).
Treat alerting as a workflow, not a firehose:
Keep SLA logic out of ingestion and heavy computation out of dashboards. Start with a simple deployment (single region, minimal environments) until you trust data quality and alert usefulness.
(work_item_id, sla_rule_id, alert_type) and send only on state transitions with a cooldown.Every alert should include: owner/on-call target, due time and remaining time, the next action, and links like /tickets/{id} and /sla/tickets/{id}.