May 19, 2025·8 min
Create a Web App to Analyze Cancellations and Test Retention
Learn how to plan, build, and launch a web app that tracks subscription cancellations, analyzes drivers, and runs retention experiments safely.
What You’re Building and Why It Matters
Cancellations are one of the highest-signal moments in a subscription business. A customer is explicitly telling you, “this isn’t worth it anymore,” often right after hitting friction, disappointment, or a pricing/value mismatch. If you treat cancellation as a simple status change, you lose a rare chance to learn what’s breaking—and to fix it.
The problem you’re solving
Most teams only see churn as a monthly number. That hides the story:
- Who is canceling (new users vs. long-term customers, plan type, segment)
- When they cancel (day 1, after trial, after a price increase, after a failed payment)
- Why they cancel (too expensive, missing features, bugs, switching to a competitor, “not using it”)
This is what subscription cancellation analysis means in practice: turning a cancellation click into structured data you can trust and slice.
What “retention experiments” mean
Once you can see patterns, you can test changes designed to reduce churn—without guessing. Retention experiments can be product, pricing, or messaging changes, such as:
- improving the cancellation flow (clearer options, better downgrade paths)
- offering a pause plan or discount to the right segment
- fixing onboarding gaps that correlate with early cancellations
The key is measuring impact with clean, comparable data (for example, an A/B test).
What you’ll build in this guide
You’re building a small system with three connected parts:
- Tracking: events around the subscription lifecycle and the cancellation flow, including reasons.
- A dashboard: funnels, cohorts, and segments that reveal where churn is coming from.
- An experiments loop: the ability to run targeted tests and see whether churn actually drops.
By the end, you’ll have a workflow that moves from “we had more cancellations” to “this specific segment cancels after week 2 because of X—and this change reduced churn by Y%.”
What success looks like
Success isn’t a prettier chart—it’s speed and confidence:
- Faster insights (days, not months)
- Measurable churn reduction tied to specific changes
- Repeatable learning: every cancellation teaches you something you can act on
Set Goals, Metrics, and Scope for the MVP
Before you build screens, tracking, or dashboards, get painfully clear on what decisions this MVP should enable. A cancellation analytics app succeeds when it answers a few high-value questions quickly—not when it tries to measure everything.
Start with the questions that drive action
Write down the questions you want to answer in your first release. Good MVP questions are specific and lead to obvious next steps, for example:
- What are the top cancellation reasons, and how do they differ by plan, region, or signup channel?
- How long does it take customers to cancel (time-to-cancel), and what patterns show up in the first 7/30/90 days?
- Which plans (or billing cycles) have the highest cancel rate, and are users downgrading before canceling?
If a question doesn’t influence a product change, support playbook, or experiment, park it for later.
Pick 3–5 “north star” MVP metrics
Choose a short list you’ll review weekly. Keep definitions unambiguous so product, support, and leadership talk about the same numbers.
Typical starting metrics:
- Cancel rate (over a defined period, e.g., weekly/monthly)
- Save rate (share of cancel attempts that convert to a retained outcome)
- Reactivation rate (customers who return after canceling)
- Time-to-cancel (median days from start to cancellation)
- Reason distribution (top reasons by volume and by revenue impact)
For each metric, document the exact formula, time window, and exclusions (trials, refunds, failed payments).
Name the owners and the constraints
Identify who will use and maintain the system: product (decisions), support/success (reason quality and follow-ups), data (definitions and validation), and engineering (instrumentation and reliability).
Then agree on constraints up front: privacy requirements (PII minimization, retention limits), required integrations (billing provider, CRM, support tool), timeline, and budget.
Write a one-page scope to stop feature creep
Keep it short: goals, primary users, the 3–5 metrics, “must-have” integrations, and a clear non-goals list (e.g., “no full BI suite,” “no multi-touch attribution in v1”). This single page becomes your MVP contract when new requests arrive.
Model Subscriptions and Lifecycle Events
Before you can analyze cancellations, you need a subscription model that reflects how customers actually move through your product. If your data only stores the current subscription status, you’ll struggle to answer basic questions like “How long were they active before canceling?” or “Did downgrades predict churn?”
Map the lifecycle you’ll measure
Start with a simple, explicit lifecycle map your whole team agrees on:
Trial → Active → Downgrade → Cancel → Win-back
You can add more states later, but even this basic chain forces clarity about what counts as “active” (paid? within grace period?) and what counts as “win-back” (reactivated within 30 days? any time?).
Define the core entities
At minimum, model these entities so events and money can be tied together consistently:
- User: the person using the app (can change over time)
- Account: the billing/customer container (often the right “unit” for churn)
- Subscription: the agreement that can start, renew, switch, or end
- Plan: the product tier (name, price, billing interval)
- Invoice: what was billed, when, and whether it was paid/refunded
- Cancel event: when cancellation was requested and when it took effect
Choose stable identifiers (account_id vs user_id)
For churn analytics, account_id is usually the safest primary identifier because users can change (employees leave, admins switch). You can still attribute actions to user_id, but aggregate retention and cancellations at the account level unless you’re truly selling personal subscriptions.
Store status history, not just a status
Implement a status history (effective_from/effective_to) so you can query past states reliably. This makes cohort analysis and pre-cancel behavior analysis possible.
Plan for edge cases upfront
Model these explicitly so they don’t pollute churn numbers:
- Pauses (temporary stop without cancellation)
- Refunds/chargebacks (payment reversal vs. voluntary churn)
- Plan switches (upgrade/downgrade as events, not “new subscriptions”)
- Grace periods (failed payment vs. true cancellation)
Instrument the Cancellation Flow (Events and Reasons)
If you want to understand churn (and improve retention), the cancellation flow is your most valuable “moment of truth.” Instrument it like a product surface, not a form—every step should produce clear, comparable events.
Track the key steps (and make them unskippable)
At minimum, capture a clean sequence so you can build a funnel later:
cancel_started— user opens the cancel experienceoffer_shown— any save offer, pause option, downgrade path, or “talk to support” CTA is displayedoffer_accepted— user accepts an offer (pause, discount, downgrade)cancel_submitted— cancellation confirmed
These event names should be consistent across web/mobile and stable over time. If you evolve the payload, bump a schema version (e.g., schema_version: 2) rather than changing meanings silently.
Capture context that explains why it happened
Every cancellation-related event should include the same core context fields so you can segment without guesswork:
- plan, tenure, price
- country, device
- acquisition channel
Keep them as properties on the event (not inferred later) to avoid broken attribution when other systems change.
Collect churn reasons you can analyze and read
Use a predefined reason list (for charts) plus optional free-text (for nuance).
cancel_reason_code(e.g.,too_expensive,missing_feature,switched_competitor)cancel_reason_text(optional)
Store the reason on cancel_submitted, and consider also logging it when first selected (helps detect indecision or back-and-forth behavior).
Don’t stop at cancellation: track outcomes
To measure retention interventions, log downstream outcomes:
reactivateddowngradedsupport_ticket_opened
With these events in place, you can connect cancellation intent to outcomes—and run experiments without arguing about what the data “really means.”
Design Your Data Pipeline and Storage
Good churn analytics starts with boring decisions done well: where events live, how they get cleaned, and how everyone agrees on what “a cancellation” means.
Choose storage: OLTP + (optional) warehouse
For most MVPs, store raw tracking events in your primary app database (OLTP) first. It’s simple, transactional, and easy to query for debugging.
If you expect high volume or heavy reporting, add an analytics warehouse later (Postgres read replica, BigQuery, Snowflake, ClickHouse). A common pattern is: OLTP for “source of truth” + warehouse for fast dashboards.
Core tables you’ll want
Design tables around “what happened” rather than “what you think you’ll need.” A minimal set:
events: one row per tracked event (e.g.,cancel_started,offer_shown,cancel_submitted) withuser_id,subscription_id, timestamps, and JSON properties.cancellation_reasons: normalized rows for reason selections, including optional free-text feedback.experiment_exposures: who saw which variant, when, and in what context (feature flag / test name).
This separation keeps your analytics flexible: you can join reasons and experiments to cancellations without duplicating data.
Late events, duplicates, and idempotency
Cancellation flows generate retries (back button, network issues, refresh). Add an idempotency_key (or event_id) and enforce uniqueness so the same event can’t be counted twice.
Also decide a policy for late events (mobile/offline): typically accept them, but use the event’s original timestamp for analysis and the ingestion time for debugging.
ETL/ELT for reporting performance
Even without a full warehouse, create a lightweight job that builds “reporting tables” (daily aggregates, funnel steps, cohort snapshots). This keeps dashboards fast and reduces expensive joins on raw events.
Document definitions so metrics match
Write a short data dictionary: event names, required properties, and metric formulas (e.g., “churn rate uses cancel_effective_at”). Put it in your repo or internal docs so product, data, and engineering interpret charts the same way.
Build the Dashboard: Funnels, Cohorts, and Segments
Scale When You’re Ready
Move beyond the basics with more capacity when your event volume and dashboards grow.
A good dashboard doesn’t try to answer every question at once. It should help you move from “something looks off” to “here’s the exact group and step causing it” in a couple of clicks.
Core views you’ll use every week
Start with three views that mirror how people actually investigate churn:
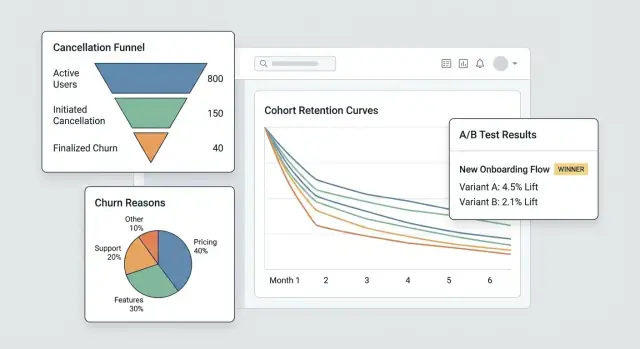
- Cancellation funnel: from
cancel_started→ reason selected →offer_shown→offer_acceptedorcancel_submitted. This reveals where people drop out and where your save flow is (or isn’t) getting attention. - Reasons distribution: a breakdown of selected cancellation reasons, with an “Other (free text)” bucket that can be sampled. Show both counts and % so spikes are obvious.
- Cohorts by start month: retention or cancellation rate by subscription start month. Cohorts make it harder to fool yourself with seasonality or acquisition mix changes.
Segments that make insights actionable
Every chart should be filterable by the attributes that affect churn and save acceptance:
- Plan or tier
- Tenure (e.g., 0–7 days, 8–30, 31–90, 90+)
- Region / country
- Acquisition source (organic, paid, partner, sales)
- Payment method (card, invoice, PayPal, etc.)
Keep the default view “All customers,” but remember: the goal is to locate which slice is changing, not just whether churn moved.
Time controls and “save flow” performance
Add fast date presets (last 7/30/90 days) plus a custom range. Use the same time control across views to avoid mismatched comparisons.
For retention work, track the save flow as a mini-funnel with business impact:
- Offer views
- Offer acceptance rate
- Net retained MRR (MRR kept after discounts, credits, or downgrades)
Drill-down without breaking trust
Every aggregated chart should support a drill-down to a list of affected accounts (e.g., “customers who selected ‘Too expensive’ and canceled within 14 days”). Include columns like plan, tenure, and last invoice.
Gate drill-down behind permissions (role-based access), and consider masking sensitive fields by default. The dashboard should empower investigation while respecting privacy and internal access rules.
Add an Experiment Framework (A/B Tests and Targeting)
If you want to reduce cancellations, you need a reliable way to test changes (copy, offers, timing, UI) without arguing from opinions. An experiment framework is the “traffic cop” that decides who sees what, records it, and ties outcomes back to a specific variant.
1) Define the experiment unit (avoid cross-contamination)
Decide whether assignment happens at the account level or user level.
- Account-level is usually safest for SaaS: everyone in the same workspace sees the same variant, preventing mixed messages and contaminated results.
- User-level can work for consumer apps, but beware shared devices, multiple logins, or team accounts.
Write this choice down per experiment so your analysis is consistent.
2) Choose an assignment method
Support a few targeting modes:
- Random (classic A/B): best default.
- Weighted (e.g., 90/10): useful when rolling out cautiously.
- Rules-based targeting: only show a variant to specific segments (plan tier, country, tenure, “about to cancel” state). Keep rules simple and versioned.
3) Log exposure when it truly happens
Don’t count “assigned” as “exposed.” Log exposure when the user actually sees the variant (e.g., the cancellation screen rendered, the offer modal opened). Store: experiment_id, variant_id, unit id (account/user), timestamp, and relevant context (plan, seat count).
4) Define metrics: primary + guardrails
Pick one primary success metric, such as save rate (cancel_started → retained outcome). Add guardrails to prevent harmful wins: support contacts, refund requests, complaint rate, time-to-cancel, or downgrade churn.
5) Plan duration and sample size assumptions
Before launching, decide:
- Minimum run time (often 1–2 billing cycles for subscription behavior)
- Minimum sample size based on current save rate and the smallest lift you care about
This prevents stopping early on noisy data and helps your dashboard show “still learning” vs. “statistically useful.”
Design Retention Interventions to Test
Extend to Mobile
Create a Flutter companion app for support or success teams to review cancellation context.
Retention interventions are the “things you show or offer” during cancellation that might change someone’s mind—without making them feel tricked. The goal is to learn which options reduce churn while keeping trust high.
Common intervention variants to try
Start with a small menu of patterns you can mix and match:
- Alternative offers: a limited-time discount, a free month, or extended trial
- Pause option: let users pause billing for 1–3 months (and set expectations for reactivation)
- Plan downgrade: switch to a cheaper tier or fewer seats instead of full cancellation
- Message copy: short, specific copy that reminds them of value (“Export your data anytime”) vs. generic copy (“We’re sorry to see you go”)
Design offers that don’t trap users
Make every choice clear and reversible where possible. The “Cancel” path should be visible and require no scavenger hunt. If you offer a discount, say exactly how long it lasts and what the price returns to afterward. If you offer pause, show what happens to access and billing dates.
A good rule: a user should be able to explain what they selected in one sentence.
Use progressive disclosure
Keep the flow light:
-
Ask for a reason (one tap)
-
Show a tailored response (pause for “too expensive,” downgrade for “not using enough,” support for “bugs”)
-
Confirm the final outcome (pause/downgrade/cancel)
This reduces friction while keeping the experience relevant.
Add a results page and a changelog
Create an internal experiment results page that shows: conversion to “saved” outcome, churn rate, lift vs. control, and either a confidence interval or simple decision rules (e.g., “ship if lift ≥ 3% and sample ≥ 500”).
Keep a changelog of what was tested and what shipped, so future tests don’t repeat old ideas and you can connect retention shifts to specific changes.
Privacy, Security, and Access Control
Cancellation data is some of the most sensitive product data you’ll handle: it often includes billing context, identifiers, and free-text that can contain personal details. Treat privacy and security as product requirements, not an afterthought.
Authentication and roles
Start with authenticated access only (SSO if you can). Then add simple, explicit roles:
- Admin: manage settings, data retention, user access, and exports.
- Analyst: view dashboards, create segments, run experiments.
- Support: view customer-level history needed to help (limited fields).
- Read-only: view aggregate dashboards without drill-down.
Make role checks server-side, not just in the UI.
Minimize sensitive data exposure
Limit who can see customer-level records. Prefer aggregates by default, with drill-down behind stronger permissions.
- Mask identifiers (email, customer ID) in the UI where possible.
- Hash identifiers for joins and deduping (e.g., SHA-256 with a secret salt) so analysts can segment without seeing raw PII.
- Separate “billing/identity” tables from event analytics tables, connected via a hashed key.
Data retention rules
Define retention up front:
- Keep event data only as long as needed for cohort analysis (e.g., 13–18 months).
- Apply shorter retention or redaction for free-text cancellation reasons, which may include accidental personal info.
- Provide deletion workflows to honor user requests and internal policies.
Audit logs
Log dashboard access and exports:
- Who viewed customer-level pages
- Who exported data, when, and what filters were used
- Admin changes to retention and permissions
Launch security checklist
Cover the basics before shipping: OWASP top risks (XSS/CSRF/injection), TLS everywhere, least-privilege database accounts, secrets management (no keys in code), rate limiting on auth endpoints, and tested backup/restore procedures.
Implementation Blueprint (Frontend, Backend, and Testing)
This section maps the build into three parts—backend, frontend, and quality—so you can ship an MVP that’s consistent, fast enough for real usage, and safe to evolve.
Backend: subscriptions, events, and experiments
Start with a small API that supports CRUD for subscriptions (create, update status, pause/resume, cancel) and stores key lifecycle dates. Keep write paths simple and validated.
Next, add an event ingestion endpoint for tracking actions like “opened cancellation page,” “selected reason,” and “confirmed cancel.” Prefer server-side ingestion (from your backend) when possible to reduce ad blockers and tampering. If you must accept client events, sign requests and rate-limit.
For retention experiments, implement experiment assignment server-side so the same account always gets the same variant. A typical pattern is: fetch eligible experiments → hash (account_id, experiment_id) → assign variant → persist the assignment.
If you want to prototype this quickly, a vibe-coding platform like Koder.ai can generate the foundation (React dashboard, Go backend, PostgreSQL schema) from a short spec in chat—then you can export the source code and adapt the data model, event contracts, and permissions to your needs.
Frontend: dashboard, filters, and exports
Build a handful of dashboard pages: funnels (cancel_started → offer_shown → cancel_submitted), cohorts (by signup month), and segments (plan, country, acquisition channel). Keep filters consistent across pages.
For controlled sharing, provide CSV export with guardrails: export only aggregated results by default, require elevated permissions for row-level exports, and log exports for audit.
Performance basics
Use pagination for event lists, index common filters (date, subscription_id, plan), and add pre-aggregations for heavy charts (daily counts, cohort tables). Cache “last 30 days” summaries with a short TTL.
Testing and reliability
Write unit tests for metric definitions (e.g., what counts as “cancellation started”) and for assignment consistency (the same account always lands in the same variant).
For ingestion failures, implement retries and a dead-letter queue to prevent silent data loss. Surface errors in logs and an admin page so you can fix issues before they distort decisions.
Deploy, Monitor, and Keep Data Trustworthy
Iterate Without Fear
Iterate on sensitive cancellation UI with snapshots and rollback when a change misbehaves.
Shipping your cancellation analytics app is only half the work. The other half is keeping it accurate while your product and experiments change week to week.
Choose a deployment approach
Pick the simplest option that matches your team’s operating style:
- Managed hosting (PaaS): fastest path to production if you want built-in deploys, logs, and scaling.
- Containers (Docker + orchestrator): best when you need repeatable builds and tighter control over dependencies.
- Serverless: great for spiky workloads (event ingestion, scheduled validation jobs), but watch cold starts and vendor-specific limits.
Whichever you choose, treat the analytics app like a production system: version it, automate deployments, and keep config in environment variables.
If you don’t want to own the full pipeline on day one, Koder.ai can also handle deployment and hosting (including custom domains) and supports snapshots and rollback—useful when you’re iterating quickly on a sensitive flow like cancellation.
Separate environments (and data)
Create dev, staging, and production environments with clear isolation:
- Separate databases and storage buckets so test events don’t contaminate metrics.
- A dedicated staging environment that mirrors production schema and routing.
- Distinct experiment namespaces (e.g., prefix experiment IDs in non-prod) to prevent “phantom variants” from appearing in dashboards.
Monitoring that protects decision-making
You’re not only monitoring uptime—you’re monitoring truth:
- Uptime/health of the API, background workers, and dashboard.
- Ingestion lag (event time vs. processed time) with alerts when it drifts.
- Experiment assignment errors: sudden spikes in “unassigned units,” variant imbalance, or assignment changing for the same account.
Automated data validation jobs
Schedule lightweight checks that fail loudly:
- Missing key events (e.g.,
cancel_startedwithoutcancel_submitted, where expected). - Schema changes (new/removed properties, type changes, unexpected enums).
- Volume anomalies (events drop to near-zero after a release).
Rollback plan for experiment UI changes
For any experiment that touches the cancellation flow, pre-plan rollback:
- Feature flags to disable variants instantly.
- A quick path to redeploy the last known-good build.
- A note in the dashboard that marks the rollback window so analysts don’t misread the data.
Operate the System: From Insight to Ongoing Experiments
A cancellation analytics app only pays off when it becomes a habit, not a one-time report. The goal is to turn “we noticed churn” into a steady loop of insight → hypothesis → test → decision.
Run a simple weekly cadence
Pick a consistent time each week (30–45 minutes) and keep the ritual lightweight:
- Review the dashboard for changes in key metrics (overall churn, churn by plan, churn by tenure, and top cancellation reasons).
- Call out one anomaly worth investigating (e.g., churn spike among annual renewals, or a reason that suddenly ranks #1).
- Choose exactly one hypothesis to test next week.
Keeping it to one hypothesis forces clarity: what do we believe is happening, who is affected, and what action could change outcomes?
Prioritize experiments (impact × effort)
Avoid running too many tests at once—especially in the cancellation flow—because overlapping changes make results hard to trust.
Use a simple grid:
- High impact / low effort: do these first (copy changes, routing to support, offering annual switch).
- High impact / high effort: plan them (billing flexibility, product fixes).
- Low impact: park them.
If you’re new to experimentation, align on basics and decision rules before shipping: /blog/ab-testing-basics.
Close the loop with qualitative input
Numbers tell you what is happening; support notes and cancellation comments often tell you why. Each week, sample a handful of recent cancellations per segment and summarize themes. Then map themes to testable interventions.
Build a “winning interventions” playbook
Track learnings over time: what worked, for whom, and under what conditions. Store short entries like:
- Segment definition (plan, tenure, usage)
- Hypothesis and change shipped
- Result and confidence
- Follow-up action (roll out, iterate, or revert)
When you’re ready to standardize offers (and avoid ad-hoc discounts), tie your playbook back to your packaging and limits: /pricing.