Mar 09, 2025·8 min
CrowdStrike: Telemetry + Cloud Analytics as a Data Platform
How CrowdStrike turns endpoint telemetry and cloud analytics into a scalable data platform business—improving detection, workflows, and product expansion.
How CrowdStrike turns endpoint telemetry and cloud analytics into a scalable data platform business—improving detection, workflows, and product expansion.
Endpoint telemetry is the stream of small “facts” a device can report about what’s happening on it. Think of it as activity breadcrumbs: which processes started, what files were touched, which user logged in, what commands were run, and where the device tried to connect on the network.
A laptop or server can record and send events such as:
On their own, many of these events look normal. Telemetry matters because it preserves the sequence and context that often reveals an attack.
Most real intrusions eventually touch endpoints: phishing delivers a payload to a user device, attackers run commands to move laterally, dump credentials, or disable defenses. Network-only visibility can miss “inside the host” details (like which process initiated a connection). Endpoint telemetry helps answer practical questions fast: What ran? Who ran it? What did it change? Where did it talk to?
On-device tools can block known-bad activity locally, but cloud analytics aggregates telemetry across many machines and across time. That enables correlation (linking related events), anomaly detection, and rapid updates based on new threat intelligence.
This article explains the conceptual product and business model behind telemetry + cloud analytics as a security data platform. It does not describe proprietary vendor internals.
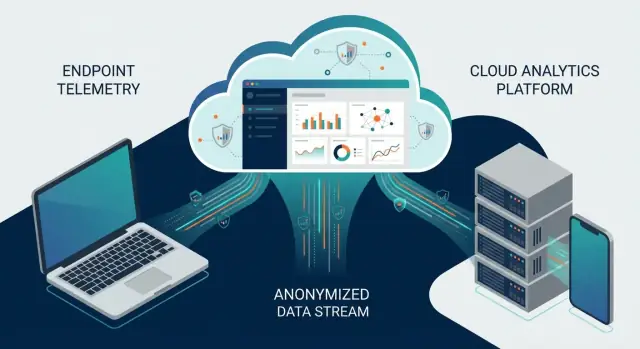
CrowdStrike’s core idea is straightforward: put a small “sensor” on each endpoint, stream useful security signals to the cloud, and let centralized analytics decide what matters. Instead of relying on heavy local scanning, the endpoint focuses on collecting telemetry and enforcing a small set of real-time protections.
At a high level, the Falcon sensor is designed to be unobtrusive. It watches for security-relevant activity—like process launches, command-line arguments, file operations, authentication events, and network connections—then packages those events as telemetry.
The goal isn’t to do all analysis on the laptop or server. It’s to capture enough context, consistently, so the cloud can correlate and interpret behavior across many machines.
A simplified pipeline looks like this:
Central analytics means detection logic can be updated quickly and applied consistently everywhere—without waiting for each endpoint to download large updates or run complex local checks. It also enables cross-environment pattern recognition and faster tuning of rules, scoring, and behavioral models.
Streaming telemetry has costs: bandwidth, data volume (and storage/retention decisions), and privacy/governance considerations—especially when events might include user, device, or command context. Evaluating what’s collected, how it’s protected, and how long it’s retained should be part of any platform review.
Endpoint telemetry is the “activity trail” a device leaves behind: what ran, what changed, who did it, and what the device talked to. A single event can look harmless; a sequence of events creates context that helps security teams decide what’s normal and what needs attention.
Most endpoint sensors focus on a handful of high-signal categories:
A single alert might say, “A new program started.” That’s rarely enough to act on. Context answers the practical questions: who was logged in, what ran, where it ran from (USB drive, downloads folder, system directory), and when it happened (right after a suspicious email was opened, or during routine patching).
For example, “a script ran” is vague. “A script ran under a finance user’s account, from a temporary folder, minutes after a new file download, and then connected to an unfamiliar internet service” is a scenario a SOC can triage quickly.
Raw telemetry becomes more valuable when it’s enriched with:
This enrichment enables higher-confidence detections, faster investigations, and clearer prioritization—without asking analysts to manually stitch together dozens of disconnected clues.
Endpoint telemetry is noisy by default: thousands of small events that become meaningful only when you can compare them to everything else happening on the device—and to what “normal” looks like across many devices.
Different operating systems and apps describe the same activity in different ways. Cloud analytics first normalizes events—mapping raw logs into consistent fields (process, parent process, command line, file hash, network destination, user, timestamp). Once data “speaks” the same language, it becomes searchable, comparable, and ready for detection logic.
A single event is rarely proof of an attack. Correlation connects related events across time:
Individually, these may be explainable. Together, they describe an intrusion chain.
Signature-only detection looks for known-bad artifacts (specific hashes, exact strings). Behavioral detection asks: does this act like an attack? For example, “credential dumping behavior” or “lateral movement pattern” can be detected even when the exact malware family is new.
Cloud-scale analytics can spot repeatable patterns (new attack techniques, emerging malicious infrastructure) by aggregating signals and statistical trends, not by exposing one customer’s private content. The advantage is broader context: what’s rare, what’s spreading, and what’s newly correlated.
More context usually means fewer noisy alerts. When analytics can see process lineage, reputation, prevalence, and the full sequence of actions, it can downgrade benign admin behavior and prioritize genuinely risky chains—so the SOC spends time on real incidents, not harmless anomalies.
A “data platform business” in security is built around a simple loop: collect high-quality security data, analyze it centrally, and package the results into products people can buy and use. The differentiator isn’t just having an endpoint agent or a console—it’s turning a continuous stream of telemetry into multiple outcomes: detections, investigations, automated responses, reporting, and long-term analytics.
On the collection side, endpoints generate events about processes, network connections, logins, file activity, and more. By sending that telemetry to a cloud backend, analytics can improve without constantly redeploying tools.
The packaging step is where a platform becomes a business: the same underlying data can power different “modules” (endpoint protection, EDR, identity signals, vulnerability context, threat hunting, posture checks) that are sold as separate capabilities or tiers.
Once the telemetry pipeline, storage, and analytics layer exist, adding a new module often means adding new analytics and workflows, not rebuilding collection from scratch. Teams can reuse:
Point tools typically solve one problem with one dataset. Platforms can compound value: new modules make the shared data more useful, which improves detection and investigation, which increases adoption of additional modules. For a SOC, a unified UI and shared workflows can also reduce context switching—less time exporting logs, correlating alerts, or reconciling conflicting asset lists.
A telemetry-driven security platform benefits from a simple flywheel: more telemetry leads to better detections, which creates more customer value, which drives more adoption, which in turn produces more telemetry.
A useful analogy is a navigation app. As more drivers share anonymous location and speed data, the app learns where traffic is forming, predicts delays sooner, and suggests better routes. Those better routes attract more users, which improves the predictions again.
With endpoint telemetry, the “traffic patterns” are behaviors like process launches, file changes, credential use, and network connections. When many organizations contribute signals, cloud analytics can spot:
The result is faster, more accurate detections and fewer false alarms—practical outcomes a SOC feels immediately.
Because the heavy analytics live in the cloud, improvements can roll out centrally. New detection logic, correlation rules, and machine-learning models can be updated without waiting for every customer to manually tune rules. Customers still need endpoint components, but much of the “brain” can evolve continuously.
This model has limits and responsibilities:
The strongest platforms treat the flywheel as an engineering and trust problem—not just a growth story.
When endpoint telemetry is normalized into a shared cloud dataset, the biggest win is operational: the SOC stops juggling disconnected tools and starts running a repeatable workflow on one source of truth.
Detect. A detection fires because analytics spot suspicious behavior (for example, an unusual child process spawning PowerShell plus a credential access attempt). Instead of an alert that’s just a headline, it arrives with the key surrounding events already attached.
Investigate. The analyst pivots inside the same dataset: process tree, command line, hash reputation, user context, device history, and “what else looks similar” across the fleet. That reduces the time spent opening a SIEM tab, an EDR console, a threat intel portal, and a separate asset inventory.
Contain. With confidence built from correlated telemetry, the SOC can isolate a host, kill a process, or block an indicator without waiting for a second team to validate basic facts.
Remediate. Remediation becomes more consistent because you can search for the same behavior across all endpoints, confirm scope, and verify cleanup using the same telemetry pipeline.
Report. Reporting is faster and clearer: timeline, impacted devices/users, actions taken, and evidence links come from the same underlying event record.
A shared telemetry foundation cuts duplicate alerts (multiple tools flagging the same activity) and enables better grouping—one incident instead of twenty notifications. Faster triage matters because it saves analyst hours, reduces mean time to respond, and limits how many cases get escalated “just in case.” If you’re comparing broader detection approaches, see /blog/edr-vs-xdr.
EDR (Endpoint Detection and Response) is endpoint-first: it focuses on what happens on laptops, servers, and workloads—processes, files, logins, and suspicious behavior—and helps you investigate and respond.
XDR (Extended Detection and Response) expands that idea to more sources than endpoints, such as identity, email, network, and cloud control-plane events. The goal isn’t to collect everything, but to connect what matters so an alert becomes an incident story you can act on.
If detections are built in the cloud, you can add new telemetry sources over time without rebuilding every endpoint sensor. New connectors (for example, identity providers or cloud logs) feed into the same backend analytics, so rules, machine learning, and correlation logic can evolve centrally.
Practically, this means you’re extending a shared detection engine: the same enrichment (asset context, threat intel, prevalence), the same correlation, and the same investigation tools—just with a wider set of inputs.
“Single pane of glass” shouldn’t be a dashboard with a dozen tiles. It should mean:
When assessing an EDR-to-XDR platform, ask vendors:
A telemetry-driven security platform rarely sells “data” directly. Instead, the vendor packages the same underlying event stream into productized outcomes—detections, investigations, response actions, and compliance-ready reporting. This is why platforms often look like a set of modules that can be turned on as needs grow.
Most offerings build on shared building blocks:
Modules make cross-sell and upsell feel natural because they map to changing risk and operational maturity:
The key driver is consistency: the same telemetry and analytics foundation supports more use cases with less tooling sprawl.
Data platforms often price through a mix of modules, feature tiers, and sometimes usage-based factors (for example, retention, event volume, or advanced analytics). More telemetry can improve outcomes, but it also increases storage, processing, and governance costs—so pricing commonly reflects both capability and scale. For a general overview, see /pricing.
Telemetry can improve detection and response, but it also creates a sensitive data stream: process activity, file metadata, network connections, and user/device context. A strong security outcome should not require “collect everything forever.” The best platforms treat privacy and governance as first-class design constraints.
Data minimization: Collect only what’s necessary for security analytics, prefer hashes/metadata over full content when possible, and document the rationale for each telemetry category.
Access controls: Expect tight role-based access control (RBAC), least-privilege defaults, separation of duties (for example, analysts vs. admins), strong authentication, and detailed audit logs for both console actions and data access.
Retention and deletion: Clear retention windows, configurable policies, and practical deletion workflows matter. Retention should align to threat hunting needs and regulatory expectations, not just vendor convenience.
Regional processing: For multinational teams, where data is processed and stored is a governance requirement. Look for options that support regional data residency or controlled processing locations.
Many buyers need alignment with common assurance frameworks and privacy regulations—often SOC 2, ISO 27001, and GDPR. You don’t need a vendor to “promise compliance,” but you do need evidence: independent reports, data processing terms, and transparent sub-processor lists.
A useful rule of thumb: your security platform should measurably reduce risk while still being explainable to legal, privacy, and compliance stakeholders.
A telemetry-first security platform only delivers value if it can plug into the systems where teams already work. Integrations turn detections into actions, documentation, and measurable outcomes.
Most organizations connect endpoint security telemetry to a few core tools:
As security shifts from a single product to a platform, APIs become the control surface. Good APIs let teams:
In practice, this reduces swivel-chair work and makes outcomes repeatable across environments.
A practical note: many teams end up building small internal apps around these APIs (triage dashboards, enrichment services, case-routing helpers). Vibe-coding platforms like Koder.ai can speed up that “last mile” work—standing up a React-based web UI with a Go + PostgreSQL backend (and deploying it) from a chat-driven workflow—so security and IT teams can prototype integrations quickly without a long traditional dev cycle.
A healthy integration ecosystem enables concrete results: automated containment for high-confidence threats, instant case creation with evidence attached, and consistent reporting for compliance and exec updates.
If you want a quick sense of the available connectors and workflows, see the integration overview at /integrations.
Buying “telemetry + cloud analytics” is really buying a repeatable security outcome: better detections, faster investigations, and smoother response. The best way to evaluate any telemetry-driven platform (CrowdStrike or alternatives) is to focus on what you can verify quickly in your own environment.
Start with the basics, then move up the stack from data to outcomes.
Keep the pilot small, realistic, and measurable.
Too many alerts is usually a symptom of weak tuning defaults or missing context. Unclear ownership shows up when IT, security, and incident response don’t agree on who can isolate hosts or remediate. Weak endpoint coverage quietly breaks the promise: gaps create blind spots that analytics can’t magically fill.
A telemetry-driven security platform earns its keep when endpoint data plus cloud analytics translates into fewer, higher-quality alerts and faster, more confident response—at a scale that feels like a platform, not another tool.
Endpoint telemetry is a continuous stream of security-relevant events from a device—things like process starts, command lines, file/registry changes, logins, and network connections.
It matters because attacks are usually revealed by the sequence of actions (what launched what, what changed, and what it contacted), not by a single isolated alert.
Networks show traffic patterns, but they often can’t tell you which process initiated a connection, what command ran, or what changed on disk.
Endpoints can answer the operational questions that drive triage:
A lightweight endpoint sensor focuses on collecting high-signal events and applying a small set of real-time protections locally.
Cloud analytics does the heavy lifting at scale:
Common high-signal categories include:
You typically get the best results when these are collected consistently across your fleet.
Normalization translates diverse raw events into consistent fields (e.g., process, parent process, command line, hash, destination, user, timestamp).
That consistency enables:
Signature detection looks for known bad artifacts (specific hashes, exact strings, recognized malware).
Behavioral detection looks for attack-like patterns (e.g., suspicious process lineage, credential dumping behaviors, persistence creation) that can flag previously unseen variants.
In practice, strong platforms use both: signatures for speed and confidence, behavior for resilience to novel threats.
Correlation connects related events into an incident storyline (for example: attachment → script → PowerShell → scheduled task → rare outbound domain).
This reduces false positives because the platform can weigh context and sequence instead of treating each event as a standalone emergency.
Centralized cloud analytics can roll out improved detection logic quickly and apply it consistently across endpoints—without waiting for heavy local updates.
It can also use broader statistical context (what’s rare, what’s spreading, what’s newly linked) to prioritize truly suspicious chains—while still keeping governance controls in mind (minimization, retention, access).
Key trade-offs to evaluate include:
A practical review includes verifying what’s collected by default, what can be disabled, who can export raw data, and how access is audited.
A proof-of-value pilot should measure outcomes, not marketing claims:
Also confirm integration paths (SIEM/SOAR/ITSM) so detections turn into repeatable workflows.