Sep 21, 2025·8 min
Disruptor pattern for low latency: predictable real time design
Learn the Disruptor pattern for low latency and how to design real time systems with predictable response times using queues, memory, and architecture choices.
Learn the Disruptor pattern for low latency and how to design real time systems with predictable response times using queues, memory, and architecture choices.
Speed has two faces: throughput and latency. Throughput is how much work you finish per second (requests, messages, frames). Latency is how long a single unit of work takes from start to finish.
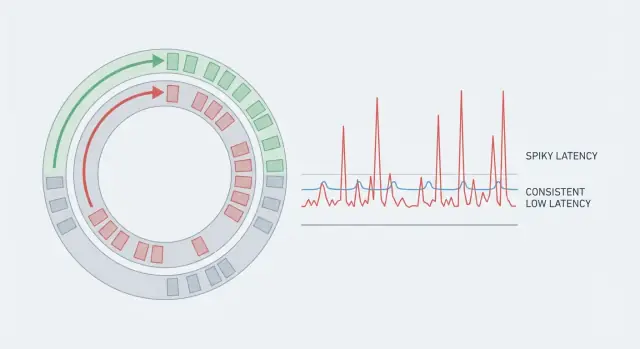
A system can have great throughput and still feel slow if some requests take much longer than others. That’s why averages mislead. If 99 actions take 5 ms and one action takes 80 ms, the average looks fine, but the person who hit the 80 ms case feels the stutter. In real-time systems, those rare spikes are the whole story because they break rhythm.
Predictable latency means you don’t just aim for a low average. You aim for consistency, so most operations finish within a tight range. That’s why teams watch the tail (p95, p99). It’s where the pauses hide.
A 50 ms spike can matter in places like voice and video (audio glitches), multiplayer games (rubber-banding), real-time trading (missed prices), industrial monitoring (late alarms), and live dashboards (numbers jump, alerts feel unreliable).
A simple example: a chat app may deliver messages quickly most of the time. But if a background pause makes one message arrive 60 ms late, typing indicators flicker and the conversation feels laggy even though the server looks “fast” on average.
If you want real-time to feel real, you need fewer surprises, not just faster code.
Most real-time systems aren’t slow because the CPU is struggling. They feel slow because work spends most of its life waiting: waiting to be scheduled, waiting in a queue, waiting on the network, or waiting for storage.
End-to-end latency is the full time from “something happened” to “the user sees the result.” Even if your handler runs in 2 ms, the request can still take 80 ms if it pauses in five different places.
A useful way to break down the path is:
Those waits stack up. A few milliseconds here and there turns a “fast” code path into a slow experience.
Tail latency is where users start to complain. Average latency might look fine, but p95 or p99 means the slowest 5% or 1% of requests. Outliers usually come from rare pauses: a GC cycle, a noisy neighbor on the host, brief lock contention, a cache refill, or a burst that creates a queue.
Concrete example: a price update arrives over the network in 5 ms, waits 10 ms for a busy worker, spends 15 ms behind other events, then hits a database stall for 30 ms. Your code still ran in 2 ms, but the user waited 62 ms. The goal is to make every step predictable, not just the computation fast.
A fast algorithm can still feel slow if time per request swings around. Users notice spikes, not averages. That swing is jitter, and it often comes from things your code doesn’t fully control.
CPU caches and memory behavior are hidden costs. If hot data doesn’t fit in cache, the CPU stalls while it waits for RAM. Object-heavy structures, scattered memory, and “just one more lookup” can turn into repeated cache misses.
Memory allocation adds its own randomness. Allocating lots of short-lived objects increases pressure on the heap, which later shows up as pauses (garbage collection) or allocator contention. Even without GC, frequent allocations can fragment memory and hurt locality.
Thread scheduling is another common source. When a thread is descheduled, you pay context switch overhead and lose cache warmth. On a busy machine, your “real-time” thread might wait behind unrelated work.
Lock contention is where predictable systems often fall apart. A lock that’s “usually free” can turn into a convoy: threads wake up, fight for the lock, and put each other back to sleep. The work still gets done, but tail latency stretches.
I/O waits can dwarf everything else. A single syscall, a full network buffer, a TLS handshake, a disk flush, or a slow DNS lookup can create a sharp spike that no micro-optimization will fix.
If you’re hunting jitter, start by looking for cache misses (often caused by pointer-heavy structures and random access), frequent allocations, context switches from too many threads or noisy neighbors, lock contention, and any blocking I/O (network, disk, logging, synchronous calls).
Example: a price-ticker service may compute updates in microseconds, but one synchronized logger call or a contended metrics lock can intermittently add tens of milliseconds.
Martin Thompson is known in low-latency engineering for focusing on how systems behave under pressure: not just average speed, but predictable speed. Along with the LMAX team, he helped popularize the Disruptor pattern, a reference approach for moving events through a system with small and consistent delays.
The Disruptor approach is a response to what makes many “fast” apps unpredictable: contention and coordination. Typical queues often rely on locks or heavy atomics, wake threads up and down, and create bursts of waiting when producers and consumers fight over shared structures.
Instead of a queue, Disruptor uses a ring buffer: a fixed-size circular array that holds events in slots. Producers claim the next slot, write data, then publish a sequence number. Consumers read in order by following that sequence. Because the buffer is preallocated, you avoid frequent allocations and reduce pressure on the garbage collector.
A key idea is the single-writer principle: keep one component responsible for a given piece of shared state (for example, the cursor that advances through the ring). Fewer writers means fewer “who goes next?” moments.
Backpressure is explicit. When consumers fall behind, producers eventually reach a slot that’s still in use. At that point the system must wait, drop, or slow down, but it does so in a controlled, visible way instead of hiding the problem inside an ever-growing queue.
What makes Disruptor-style designs fast isn’t a clever micro-optimization. It’s removing the unpredictable pauses that happen when a system fights its own moving parts: allocations, cache misses, lock contention, and slow work mixed into the hot path.
A useful mental model is an assembly line. Events move through a fixed route with clear handoffs. That reduces shared state and makes each step easier to keep simple and measurable.
Fast systems avoid surprise allocations. If you preallocate buffers and reuse message objects, you reduce “sometimes” spikes caused by garbage collection, heap growth, and allocator locks.
It also helps to keep messages small and stable. When the data you touch per event fits in CPU cache, you spend less time waiting on memory.
In practice, the habits that usually matter most are: reuse objects instead of creating new ones per event, keep event data compact, prefer a single writer for shared state, and batch carefully so you pay coordination costs less often.
Real-time apps often need extras like logging, metrics, retries, or database writes. The Disruptor mindset is to isolate those from the core loop so they can’t block it.
In a live pricing feed, the hot path might only validate a tick and publish the next price snapshot. Anything that can stall (disk, network calls, heavy serialization) moves to a separate consumer or side channel, so the predictable path stays predictable.
Predictable latency is mostly an architecture problem. You can have fast code and still get spikes if too many threads fight over the same data, or if messages bounce across the network for no good reason.
Start by deciding how many writers and readers touch the same queue or buffer. A single producer is easier to keep smooth because it avoids coordination. Multi-producer setups can raise throughput, but often add contention and make worst-case timing less predictable. If you need multiple producers, reduce shared writes by sharding events by key (for example, by userId or instrumentId) so each shard has its own hot path.
On the consumer side, a single consumer gives the most stable timing when ordering matters, because state stays local to one thread. Worker pools help when tasks are truly independent, but they add scheduling delays and can reorder work unless you’re careful.
Batching is another tradeoff. Small batches cut overhead (fewer wakeups, fewer cache misses), but batching can also add waiting time if you hold events to fill a batch. If you batch in a real-time system, cap the wait time (for example, “up to 16 events or 200 microseconds, whichever comes first”).
Service boundaries matter too. In-process messaging is usually best when you need tight latency. Network hops can be worth it for scaling, but each hop adds queues, retries, and variable delay. If you need a hop, keep the protocol simple and avoid fan-out in the hot path.
A practical rule set: keep a single-writer path per shard when you can, scale by sharding keys rather than sharing one hot queue, only batch with a strict time cap, add worker pools only for parallel and independent work, and treat every network hop as a potential jitter source until you’ve measured it.
Start with a written latency budget before touching code. Pick a target (what “good” feels like) and a p99 (what you must stay under). Split that number across stages like input, validation, matching, persistence, and outbound updates. If a stage has no budget, it has no limit.
Next, draw the full data flow and mark every handoff: thread boundaries, queues, network hops, and storage calls. Each handoff is a place where jitter hides. When you can see them, you can reduce them.
A workflow that keeps designs honest:
Then decide what can be asynchronous without breaking the user experience. A simple rule: anything that changes what the user sees “now” stays on the critical path. Everything else moves out.
Analytics, audit logs, and secondary indexing are often safe to push off the hot path. Validation, ordering, and steps needed to produce the next state usually can’t be.
Fast code can still feel slow when the runtime or OS pauses your work at the wrong moment. The goal isn’t only high throughput. It’s fewer surprises in the slowest 1% of requests.
Garbage collected runtimes (JVM, Go, .NET) can be great for productivity, but they can introduce pauses when memory needs cleanup. Modern collectors are much better than they used to be, yet tail latency can still jump if you create lots of short-lived objects under load. Non-GC languages (Rust, C, C++) avoid GC pauses, but push the cost into manual ownership and allocation discipline. Either way, memory behavior matters as much as CPU speed.
The practical habit is simple: find where allocations happen and make them boring. Reuse objects, pre-size buffers, and avoid turning hot-path data into temporary strings or maps.
Threading choices also show up as jitter. Every extra queue, async hop, or thread pool handoff adds waiting and increases variance. Prefer a small number of long-lived threads, keep producer-consumer boundaries clear, and avoid blocking calls on the hot path.
A few OS and container settings often decide whether your tail is clean or spiky. CPU throttling from tight limits, noisy neighbors on shared hosts, and poorly placed logging or metrics can all create sudden slowdowns. If you only change one thing, start by measuring allocation rate and context switches during latency spikes.
Many latency spikes aren’t “slow code.” They’re waits you didn’t plan for: a database lock, a retry storm, a cross-service call that stalls, or a cache miss that turns into a full round trip.
Keep the critical path short. Every extra hop adds scheduling, serialization, network queues, and more places to block. If you can answer a request from one process and one data store, do that first. Split into more services only when each call is optional or tightly bounded.
Bounded waiting is the difference between fast averages and predictable latency. Put hard timeouts on remote calls, and fail quickly when a dependency is unhealthy. Circuit breakers aren’t just about saving servers. They cap how long users can be stuck.
When data access blocks, separate the paths. Reads often want indexed, denormalized, cache-friendly shapes. Writes often want durability and ordering. Separating them can remove contention and reduce lock time. If your consistency needs allow it, append-only records (an event log) often behave more predictably than in-place updates that trigger hot-row locking or background maintenance.
A simple rule for real-time apps: persistence shouldn’t sit on the critical path unless you truly need it for correctness. Often the better shape is: update in memory, respond, then persist asynchronously with a replay mechanism (like an outbox or write-ahead log).
In many ring-buffer pipelines this ends up as: publish to an in-memory buffer, update state, respond, then let a separate consumer batch writes to PostgreSQL.
Picture a live collaboration app (or a small multiplayer game) that pushes updates every 16 ms (about 60 times per second). The goal isn’t “fast on average.” It’s “usually under 16 ms,” even when one user’s connection is bad.
A simple Disruptor-style flow looks like this: user input becomes a small event, it’s published into a preallocated ring buffer, then processed by a fixed set of handlers in order (validate -> apply -> prepare outbound messages), and finally broadcast to clients.
Batching can help at the edges. For example, batch outbound writes per client once per tick so you call the network layer fewer times. But don’t batch inside the hot path in a way that waits “just a bit longer” for more events. Waiting is how you miss the tick.
When something gets slow, treat it as a containment problem. If one handler slows down, isolate it behind its own buffer and publish a lightweight work item instead of blocking the main loop. If one client is slow, don’t let it back up the broadcaster; give each client a small send queue and drop or coalesce old updates so you keep the latest state. If buffer depth grows, apply backpressure at the edge (stop accepting extra inputs for that tick, or degrade features).
You know it’s working when the numbers stay boring: backlog depth hovers near zero, dropped/coalesced events are rare and explainable, and p99 stays below your tick budget during realistic load.
Most latency spikes are self-inflicted. The code can be fast, but the system still pauses when it waits on other threads, the OS, or anything outside the CPU cache.
A few mistakes show up repeatedly:
A quick way to reduce spikes is to make waits visible and bounded. Put slow work on a separate path, cap queues, and decide what happens when you’re full (drop, shed load, or degrade features).
Treat predictable latency like a product feature, not an accident. Before tuning code, make sure the system has clear goals and guardrails.
A simple test: simulate a burst (10x normal traffic for 30 seconds). If p99 explodes, ask where the waiting happens: growing queues, a slow consumer, a GC pause, or a shared resource.
Treat the Disruptor pattern as a workflow, not a library choice. Prove predictable latency with a thin slice before you add features.
Pick one user action that must feel instant (for example, “new price arrives, UI updates”). Write down the end-to-end budget, then measure p50, p95, and p99 from day one.
A sequence that tends to work:
If you’re building on Koder.ai (koder.ai), it can help to map the event flow first in Planning Mode so queues, locks, and service boundaries don’t appear by accident. Snapshots and rollback also make it easier to run repeated latency experiments and back out changes that improve throughput but worsen p99.
Keep measurements honest. Use a fixed test script, warm up the system, and record both throughput and latency. When p99 jumps with load, don’t start by “optimizing the code.” Look for pauses from GC, noisy neighbors, logging bursts, thread scheduling, or hidden blocking calls.
Averages hide rare pauses. If most actions are fast but a few take much longer, users notice the spikes as stutter or “lag,” especially in real-time flows where rhythm matters.
Track tail latency (like p95/p99) because that’s where the noticeable pauses live.
Throughput is how much work you finish per second. Latency is how long one action takes end-to-end.
You can have high throughput while still having occasional long waits, and those waits are what make real-time apps feel slow.
Tail latency (p95/p99) measures the slowest requests, not the typical ones. p99 means 1% of operations take longer than that number.
In real-time apps, that 1% often shows up as visible jitter: audio pops, rubber-banding, flickering indicators, or missed ticks.
Most time is usually spent waiting, not computing:
A 2 ms handler can still produce 60–80 ms end-to-end if it waits in a few places.
Common jitter sources include:
To debug, correlate spikes with allocation rate, context switches, and queue depth.
Disruptor is a pattern for moving events through a pipeline with small, consistent delays. It uses a preallocated ring buffer and sequence numbers instead of a typical shared queue.
The goal is to reduce unpredictable pauses from contention, allocation, and wakeups—so latency stays “boring,” not just fast on average.
Preallocate and reuse objects/buffers in the hot loop. This reduces:
Also keep event data compact so the CPU touches less memory per event (better cache behavior).
Start with a single-writer path per shard when you can (easier to reason about, less contention). Scale by sharding keys (like userId/instrumentId) instead of having many threads fight over one shared queue.
Use worker pools only for truly independent work; otherwise you often trade throughput gains for worse tail latency and harder debugging.
Batching reduces overhead, but it can add waiting if you hold events to fill a batch.
A practical rule is to cap batching by time and size (for example: “up to N events or up to T microseconds, whichever comes first”) so batching can’t silently break your latency budget.
Write a latency budget first (target and p99), then split it across stages. Map every handoff (queues, thread pools, network hops, storage calls) and make waiting visible with metrics like queue depth and per-stage time.
Keep blocking I/O off the critical path, use bounded queues, and decide overload behavior up front (drop, shed load, coalesce, or backpressure). If you’re prototyping on Koder.ai, Planning Mode can help you sketch these boundaries early, and snapshots/rollback make it safer to test changes that affect p99.