Aug 09, 2025·8 min
How Framework Abstractions Leak When Systems Scale Up
Learn why high-level frameworks break down at scale, the most common leak patterns, the symptoms to watch for, and practical design and ops fixes.
Learn why high-level frameworks break down at scale, the most common leak patterns, the symptoms to watch for, and practical design and ops fixes.
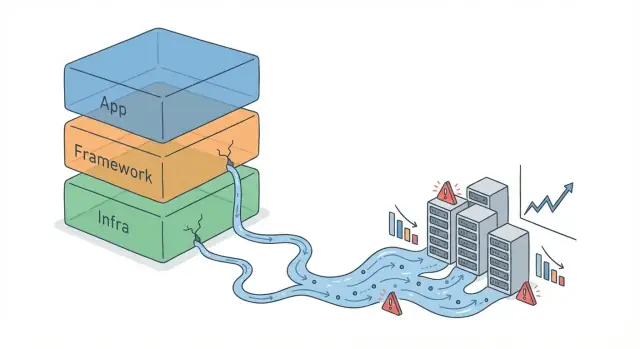
An abstraction is a simplifying layer: a framework API, an ORM, a message queue client, even a “one-line” caching helper. It lets you think in higher-level concepts (“save this object,” “send this event”) without constantly handling the lower-level mechanics.
An abstraction leak happens when those hidden details start affecting real outcomes anyway—so you’re forced to understand and manage what the abstraction tried to hide. The code still “works,” but the simplified model no longer predicts real behavior.
Early growth is forgiving. With low traffic and small datasets, inefficiencies hide behind spare CPU, empty caches, and fast queries. Latency spikes are rare, retries don’t pile up, and a slightly wasteful log line doesn’t matter.
As volume increases, the same shortcuts can amplify:
Leaky abstractions usually show up in three areas:
Next, we’ll focus on practical signals that an abstraction is leaking, how to diagnose the underlying cause (not just symptoms), and mitigation options—from configuration tweaks to deliberately “dropping down a level” when the abstraction no longer matches your scale.
A lot of software follows the same arc: a prototype proves the idea, a product ships, then usage grows faster than the original architecture. Early on, frameworks feel magical because their defaults let you move quickly—routing, database access, logging, retries, and background jobs “for free.”
At scale, you still want those benefits—but the defaults and convenience APIs start behaving like assumptions.
Framework defaults usually assume:
Those assumptions hold early, so the abstraction looks clean. But scale changes what “normal” means. A query that’s fine at 10,000 rows becomes slow at 100 million. A synchronous handler that felt simple starts timing out when traffic spikes. A retry policy that smoothed over occasional failures can amplify outages when thousands of clients retry at once.
Scale isn’t just “more users.” It’s higher data volume, bursty traffic, and more concurrent work happening at the same time. These push on the parts abstractions hide: connection pools, thread scheduling, queue depth, memory pressure, I/O limits, and rate limits from dependencies.
Frameworks often pick safe, generic settings (pool sizes, timeouts, batching behavior). Under load, those settings can translate into contention, long-tail latency, and cascading failures—problems that weren’t visible when everything fit comfortably within margins.
Staging environments rarely mirror production conditions: smaller datasets, fewer services, different caching behavior, and less “messy” user activity. In production you also have real network variability, noisy neighbors, rolling deploys, and partial failures. That’s why abstractions that seemed airtight in tests can start leaking once real-world conditions apply pressure.
When a framework abstraction leaks, the symptoms rarely show up as a neat error message. Instead, you see patterns: behavior that was fine at low traffic becomes unpredictable or expensive at higher volume.
A leaking abstraction often announces itself through user-visible latency:
These are classic signs that the abstraction is hiding a bottleneck you can’t relieve without dropping a level (e.g., inspecting actual queries, connection usage, or I/O behavior).
Some leaks show up first in invoices rather than dashboards:
If scaling up infrastructure doesn’t restore performance proportionally, it’s often not raw capacity—it’s overhead you didn’t realize you were paying.
Leaks become reliability problems when they interact with retries and dependency chains:
Use this to sanity-check before you buy more capacity:
If symptoms concentrate in one dependency (DB, cache, network) and don’t respond predictably to “more servers,” it’s a strong indicator you need to look beneath the abstraction.
ORMs are great at removing boilerplate, but they also make it easy to forget that every object eventually becomes a SQL query. At small scale, that trade-off feels invisible. At higher volumes, the database is often the first place where a “clean” abstraction starts charging interest.
N+1 happens when you load a list of parent records (1 query) and then, inside a loop, load related records for each parent (N more queries). In local testing it looks fine—maybe N is 20. In production, N becomes 2,000, and your app quietly turns one request into thousands of round trips.
The tricky part is that nothing “breaks” immediately; latency creeps up, connection pools fill, and retries multiply the load.
Abstractions often encourage fetching full objects by default, even when you only need two fields. That increases I/O, memory, and network transfer.
At the same time, ORMs can generate queries that skip the indexes you assumed were being used (or that never existed). A single missing index can turn a selective lookup into a table scan.
Joins are another hidden cost: what reads as “just include the relation” can become a multi-join query with large intermediate results.
Under load, database connections are a scarce resource. If each request fans out into multiple queries, the pool hits its limit quickly and your app starts queueing.
Long transactions (sometimes accidental) can also cause contention—locks last longer, and concurrency collapses.
Concurrency is where abstractions can feel “safe” in development and then fail loudly under load. A framework’s default model often hides the real constraint: you’re not just serving requests—you’re managing contention for CPU, threads, sockets, and downstream capacity.
Thread-per-request (common in classic web stacks) is simple: each request gets a worker thread. It breaks when slow I/O (database, API calls) causes threads to pile up. Once the thread pool is exhausted, new requests queue, latency spikes, and eventually you hit timeouts—while the server is still “busy” doing nothing but waiting.
Async/event-loop models handle many in-flight requests with fewer threads, so they’re great at high concurrency. They break differently: one blocking call (a sync library, slow JSON parsing, heavy logging) can stall the event loop, turning “one slow request” into “everything slow.” Async also makes it easy to create too much concurrency, overwhelming a dependency faster than thread limits would.
Backpressure is the system telling callers, “slow down; I can’t safely accept more.” Without it, a slow dependency (database, payment provider) doesn’t just slow responses—it increases in-flight work, memory usage, and queue lengths. That extra work makes the dependency even slower, creating a feedback loop.
Timeouts must be explicit and layered: client, service, and dependency. If timeouts are too long, queues grow and recovery takes longer. If retries are automatic and aggressive, you can trigger a retry storm: a dependency slows, calls time out, callers retry, load multiplies, and the dependency collapses.
Frameworks make networking feel like “just calling an endpoint.” Under load, that abstraction often leaks through the invisible work done by middleware stacks, serialization, and payload handling.
Each layer—API gateway, auth middleware, rate limiting, request validation, observability hooks, retries—adds a little time. One extra millisecond rarely matters in development; at scale, a handful of middleware hops can turn a 20 ms request into 60–100 ms, especially when queues form.
The key is that latency doesn’t just add—it amplifies. Small delays increase concurrency (more in-flight requests), which increases contention (thread pools, connection pools), which increases delays again.
JSON is convenient, but encoding/decoding large payloads can dominate CPU. The leak shows up as “network” slowness that’s actually application CPU time, plus extra memory churn from allocating buffers.
Large payloads also slow everything around them:
Headers can quietly bloat requests (cookies, auth tokens, tracing headers). That bloat gets multiplied across every call and every hop.
Compression is another tradeoff. It can save bandwidth, but it costs CPU and can add latency—especially when you compress small payloads or compress multiple times through proxies.
Finally, streaming vs buffering matters. Many frameworks buffer entire request/response bodies by default (to enable retries, logging, or content-length calculation). That’s convenient, but at high volume it increases memory usage and creates head-of-line blocking. Streaming helps keep memory predictable and reduces time-to-first-byte, but it requires more careful error handling.
Treat payload size and middleware depth as budgets, not afterthoughts:
When scale exposes networking overhead, the fix is often less “optimize the network” and more “stop doing hidden work on every request.”
Caching is often treated like a simple switch: add Redis (or a CDN), watch latency drop, move on. Under real load, caching is an abstraction that can leak badly—because it changes where work happens, when it happens, and how failures propagate.
A cache adds extra network hops, serialization, and operational complexity. It also introduces a second “source of truth” that can be stale, partially filled, or unavailable. When things go wrong, the system doesn’t just get slower—it can behave differently (serving old data, amplifying retries, or overloading the database).
Cache stampedes happen when many requests miss the cache at once (often after an expiry) and all rush to rebuild the same value. At scale, this can turn a small miss rate into a database spike.
Poor key design is another silent issue. If keys are too broad (e.g., user:feed without including parameters), you serve incorrect data. If keys are too specific (including timestamps, random IDs, or unordered query params), you get near-zero hit rates and pay the overhead for nothing.
Invalidation is the classic trap: updating the database is easy; ensuring every related cached view is refreshed is not. Partial invalidation leads to confusing “it’s fixed for me” bugs and inconsistent reads.
Real traffic isn’t evenly distributed. A celebrity profile, a popular product, or a shared config endpoint can become a hot key, concentrating load on a single cache entry and its backing store. Even if average performance looks fine, tail latency and node-level pressure can explode.
Frameworks often make memory feel “managed,” which is comforting—until traffic climbs and latency starts spiking in ways that don’t match CPU graphs. Many defaults are tuned for developer convenience, not for long-running processes under sustained load.
High-level frameworks routinely allocate short-lived objects per request: request/response wrappers, middleware context objects, JSON trees, regex matchers, and temporary strings. Individually, these are small. At scale, they create constant allocation pressure, pushing the runtime to run garbage collection (GC) more often.
GC pauses can become visible as brief but frequent latency spikes. As heaps grow, the pauses often get longer—not necessarily because you leaked, but because the runtime needs more time to scan and compact memory.
Under load, a service may promote objects into older generations (or similar long-lived regions) simply because they survived a few GC cycles while waiting in queues, buffers, connection pools, or in-flight requests. This can bloat the heap even if the application is “correct.”
Fragmentation is another hidden cost: memory can be free but not reusable for the sizes you need, so the process keeps asking the OS for more.
A true leak is unbounded growth over time: memory rises, never returns, and eventually triggers OOM kills or extreme GC thrash. High-but-stable usage is different: memory climbs to a plateau after warm-up, then stays roughly flat.
Start with profiling (heap snapshots, allocation flame graphs) to find hot allocation paths and retained objects.
Be cautious with pooling: it can reduce allocations, but a poorly sized pool can pin memory and worsen fragmentation. Prefer reducing allocations first (streaming instead of buffering, avoiding unnecessary object creation, limiting per-request caching), then add pooling only where measurements show clear wins.
Observability tools often feel “free” because the framework gives you convenient defaults: request logs, auto-instrumented metrics, and one-line tracing. Under real traffic, those defaults can become part of the workload you’re trying to observe.
Per-request logging is the classic example. A single line per request looks harmless—until you hit thousands of requests per second. Then you’re paying for string formatting, JSON encoding, disk or network writes, and downstream ingestion. The leak shows up as higher tail latency, CPU spikes, log pipelines falling behind, and sometimes request timeouts caused by synchronous log flushing.
Metrics can overload systems in a quieter way. Counters and histograms are cheap when you have a small number of time series. But frameworks often encourage adding tags/labels like user_id, email, path, or order_id. That leads to cardinality explosions: instead of one metric, you’ve created millions of unique series. The result is bloated memory usage in the metrics client and the backend, slow queries in dashboards, dropped samples, and surprise bills.
Distributed tracing adds storage and compute overhead that grows with traffic and with the number of spans per request. If you trace everything by default, you may pay twice: once in app overhead (creating spans, propagating context) and again in the tracing backend (ingestion, indexing, retention).
Sampling is how teams regain control—but it’s easy to do wrong. Sampling too aggressively hides rare failures; sampling too little makes tracing cost-prohibitive. A practical approach is to sample more for errors and high-latency requests, and less for healthy fast paths.
If you want a baseline for what to collect (and what to avoid), see /blog/observability-basics.
Treat observability as production traffic: set budgets (log volume, metric series count, trace ingestion), review tags for cardinality risk, and load-test with instrumentation enabled. The goal isn’t “less observability”—it’s observability that still works when your system is under pressure.
Frameworks often make calling another service feel like calling a local function: userService.getUser(id) returns quickly, errors are “just exceptions,” and retries look harmless. At small scale, that illusion holds. At large scale, the abstraction leaks because every “simple” call carries hidden coupling: latency, capacity limits, partial failures, and version mismatches.
A remote call couples two teams’ release cycles, data models, and uptime. If Service A assumes Service B is always available and fast, A’s behavior is no longer defined by its own code—it’s defined by B’s worst day. This is how systems become tightly bound even when the code looks modular.
Distributed transactions are a common trap: what looked like “save user, then charge card” becomes a multi-step workflow across databases and services. Two-phase commit rarely stays simple in production, so many systems switch to eventual consistency (e.g., “payment will be confirmed shortly”). That shift forces you to design for retries, duplicates, and out-of-order events.
Idempotency becomes essential: if a request is retried due to a timeout, it must not create a second charge or a second shipment. Framework-level retry helpers can amplify problems unless your endpoints are explicitly safe to repeat.
One slow dependency can exhaust thread pools, connection pools, or queues, creating a ripple effect: timeouts trigger retries, retries increase load, and soon unrelated endpoints degrade. “Just add more instances” may worsen the storm if everyone retries at once.
Define clear contracts (schemas, error codes, and versioning), set timeouts and budgets per call, and implement fallbacks (cached reads, degraded responses) where appropriate.
Finally, set SLOs per dependency and enforce them: if Service B can’t meet its SLO, Service A should fail fast or degrade gracefully rather than silently dragging the whole system down.
When an abstraction leaks at scale, it often shows up as a vague symptom (timeouts, CPU spikes, slow queries) that tempts teams into premature rewrites. A better approach is to turn the hunch into evidence.
1) Reproduce (make it fail on demand).
Capture the smallest scenario that still triggers the problem: the endpoint, background job, or user flow. Reproduce it locally or in staging with production-like configuration (feature flags, timeouts, connection pools).
2) Measure (pick two or three signals).
Choose a few metrics that tell you where time and resources go: p95/p99 latency, error rate, CPU, memory, GC time, DB query time, queue depth. Avoid adding dozens of new graphs mid-incident.
3) Isolate (narrow the suspect).
Use tooling to separate “framework overhead” from “your code”:
4) Confirm (prove cause and effect).
Change one variable at a time: bypass the ORM for one query, disable a middleware, reduce log volume, cap concurrency, or alter pool sizes. If the symptom moves predictably, you’ve found the leak.
Use realistic data sizes (row counts, payload sizes) and realistic concurrency (bursts, long tails, slow clients). Many leaks only appear when caches are cold, tables are large, or retries amplify load.
Abstraction leaks aren’t a moral failure of a framework—they’re a signal that your system’s needs have outgrown the “default path.” The goal isn’t to abandon frameworks, but to be deliberate about when you tune them and when you bypass them.
Stay within the framework when the issue is configuration or usage rather than a fundamental mismatch. Good candidates:
If you can fix it by tightening settings and adding guardrails, you keep upgrades easy and reduce “special cases.”
Most mature frameworks provide ways to step outside the abstraction without rewriting everything. Common patterns:
This keeps the framework as a tool, not a dependency that dictates architecture.
Mitigation is as much operational as it is code:
For related rollout practices, see /blog/canary-releases.
Drop down a level when (1) the issue hits a critical path, (2) you can measure the win, and (3) the change won’t create a long-term maintenance tax your team can’t afford. If only one person understands the bypass, it’s not “fixed”—it’s fragile.
When you’re hunting leaks, speed matters—but so does keeping changes reversible. Teams often use Koder.ai to spin up small, isolated reproductions of production issues (a minimal React UI, a Go service, a PostgreSQL schema, and a load-test harness) without burning days on scaffolding. Its planning mode helps document what you’re changing and why, while snapshots and rollback make it safer to try “drop down a level” experiments (like swapping one ORM query for raw SQL) and then revert cleanly if the data doesn’t support it.
If you’re doing this work across environments, Koder.ai’s built-in deployment/hosting and exportable source code can also help keep the diagnosis artifacts (benchmarks, repro apps, internal dashboards) as real software—versioned, shareable, and not stuck in someone’s local folder.
A leaky abstraction is a layer that tries to hide complexity (ORMs, retry helpers, caching wrappers, middleware), but under load the hidden details start changing outcomes.
Practically, it’s when your “simple mental model” stops predicting real behavior, and you’re forced to understand things like query plans, connection pools, queue depth, GC, timeouts, and retries.
Early systems have spare capacity: small tables, low concurrency, warm caches, and few failure interactions.
As volume grows, tiny overheads become steady bottlenecks, and rare edge cases (timeouts, partial failures) become normal. That’s when the hidden costs and limits of the abstraction show up in production behavior.
Look for patterns that don’t improve predictably when you add resources:
Underprovisioning usually improves roughly linearly when you add capacity.
A leak often shows:
Use the checklist in the post: if doubling resources doesn’t fix it proportionally, suspect a leak.
ORMs can hide the fact that each object operation becomes SQL. Common leaks include:
Mitigate with eager loading (carefully), selecting only needed columns, pagination, batching, and validating generated SQL with EXPLAIN.
Connection pools cap concurrency to protect the DB, but hidden query proliferation can exhaust the pool.
When the pool is full, requests queue in the app, increasing latency and holding resources longer. Long transactions worsen it by holding locks and reducing effective concurrency.
Practical fixes:
Thread-per-request fails by running out of threads when I/O is slow; everything queues and timeouts spike.
Async/event-loop fails when:
Either way, the “framework handles concurrency” abstraction leaks into needing explicit limits, timeouts, and backpressure.
Backpressure is a mechanism for saying “slow down” when a component can’t safely accept more work.
Without it, slow dependencies increase in-flight requests, memory use, and queue length—making the dependency even slower (a feedback loop).
Common tools:
Automatic retries can turn a slowdown into an outage:
Mitigate with:
Instrumentation does real work at high traffic:
user_id, email, order_id) can explode time series count and costPractical controls: