

How to Build a Mobile App for Remote Device Monitoring
Learn how to plan, build, and launch a mobile app for remote device monitoring: architecture, data flow, real-time updates, alerts, security, and testing.
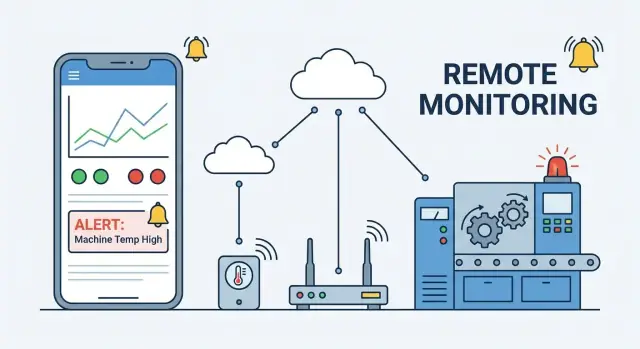
What a Remote Device Monitoring App Does
Remote device monitoring means you can see what a device is doing—and whether it’s healthy—without being physically next to it. A mobile monitoring app is the “window” into a fleet of devices: it pulls in signals from each device, turns them into understandable status, and lets the right people act quickly.
Common devices people monitor
Remote monitoring shows up anywhere equipment is distributed or hard to reach. Typical examples include:
- Sensors in buildings, cold storage, agriculture, or water systems (temperature, humidity, vibration)
- HVAC and building systems (running state, error codes, filter life)
- Industrial machines on factory floors (cycle counts, alarms, maintenance indicators)
- Vehicles and mobile assets (location, battery/engine data, utilization)
- Kiosks and digital signage (online/offline, app version, hardware health)
In all cases, the app’s job is to reduce guessing and replace it with clear, current information.
What users expect from the app
A good remote device monitoring app usually delivers four basics:
- Status at a glance: online/offline, last check-in time, key readings, and a clear “needs attention” signal.
- History and trends: what changed over time—so you can answer “when did this start?” and “is it getting worse?”
- Alerts: proactive notifications when thresholds are crossed or a device stops reporting.
- Simple controls: safe, limited actions like reboot, change mode, acknowledge an alarm, or run a diagnostic—without turning the mobile app into an engineering console.
The best apps also make it easy to search and filter by site, model, severity, or owner—because fleet monitoring is less about one device and more about priorities.
How to define success
Before you build features, define what “better monitoring” means for your team. Common success metrics include:
- Uptime visibility: fewer unknown states and faster detection of offline devices
- Faster response: reduced mean time to acknowledge and resolve incidents
- Fewer failures: earlier intervention based on telemetry trends (for example, rising temperature or declining battery health)
When these metrics improve, the monitoring app isn’t just reporting data—it’s actively preventing downtime and reducing operational cost.
Define Users, Use Cases, and the MVP
Before you pick protocols or design charts, decide who the app is for and what “success” looks like on day one. Remote monitoring apps often fail when they try to satisfy everyone with the same workflow.
Core user roles (and what each needs)
- Operator (NOC/dispatcher): fast triage, clear “what’s broken,” quick filtering by site/status, and the ability to acknowledge issues.
- Admin: user management, permissions, device onboarding rules, alert thresholds, and audit visibility.
- Field technician: actionable tasks, offline-friendly device details, last-known status, and simple “did it recover?” checks after a fix.
- Viewer (stakeholder/customer): read-only dashboards, limited device scope, and high-level health summaries.
Turn roles into use cases
Write 5–10 concrete scenarios your app must support, such as:
- “Operator gets an alert for Site A and needs to identify affected devices in under 30 seconds.”
- “Field tech scans a device ID on-site and checks recent telemetry and last command result.”
- “Admin adds a new location and restricts viewers to only that location.”
These scenarios help you avoid building features that look useful but don’t reduce response time.
Key screens to include in the MVP
At minimum, plan for:
- Device list: search, filters (status, location, model), and clear status badges.
- Device details: current status, recent telemetry, last seen time, and command history.
- Charts: simple trends (battery, temperature, signal) with sensible time ranges.
- Alerts: active vs acknowledged, severity, notes, and assignment.
- Settings: profile, notification preferences, and (for admins) users/roles.
MVP checklist: must-have vs nice-to-have
Must-have: authentication + roles, device inventory, real-time(ish) status, basic charts, alerts + push notifications, and a minimal incident workflow (acknowledge/resolve).
Nice-to-have: map view, advanced analytics, automation rules, QR onboarding, in-app chat, and custom dashboards.
Platforms: iOS, Android, or both?
Choose based on who carries the phone in the real world. If field techs are standardized on one OS, start there. If you need both quickly, a cross-platform approach can work—but keep the MVP scope tight so performance and notification behavior stay predictable.
If you’re trying to validate the MVP quickly, platforms like Koder.ai can help you prototype a monitoring UI and backend workflows from a chat-driven spec (for example: device list + device detail + alerts + roles), then iterate toward production once the core workflows are proven.
Map the Data: Telemetry, Commands, and History
Before you pick protocols or design dashboards, get specific about what data exists, where it originates, and how it should travel. A clear “data map” prevents two common failures: collecting everything (and paying for it forever), or collecting too little (and being blind during incidents).
Identify your data sources
Start by listing the signals each device can produce and how trustworthy they are:
- Sensors: temperature, vibration, battery level, power draw, door-open state.
- Logs: firmware logs, error codes, crash dumps, connectivity events.
- Health checks: “I’m alive” pings, self-test results, watchdog resets.
- Location: GPS, Wi‑Fi/cell triangulation, geofences, last known position.
For each item, note units, expected ranges, and what “bad” looks like. This becomes the backbone for later alert rules and UI thresholds.
Set update frequency needs
Not all data deserves real-time delivery. Decide what must update in seconds (e.g., safety alarms, critical machine state), what can be minutes (battery, signal strength), and what can be hourly/daily (usage summaries). Frequency drives device battery impact, data costs, and how “live” your app feels.
A practical approach is to define tiers:
- Hot telemetry: frequent, small payloads.
- Warm telemetry: periodic status.
- Cold telemetry: bulk uploads when convenient.
Decide retention: raw vs summaries
Retention is a product decision, not just a storage setting. Keep raw data long enough to investigate incidents and validate fixes, then downsample into summaries (min/max/avg, percentiles) for trend charts. Example: raw for 7–30 days, hourly aggregates for 12 months.
Plan offline behavior and delayed sync
Devices and phones will go offline. Define what gets buffered on-device, what can be dropped, and how to label delayed data in the app (e.g., “last updated 18 min ago”). Make sure timestamps come from the device (or are corrected server-side) so history remains accurate after reconnects.
Choose an Architecture That Fits Your Devices
A remote device monitoring app is only as reliable as the system behind it. Before screens and dashboards, pick an architecture that matches your device capabilities, network reality, and how “real-time” you truly need to be.
The core building blocks
Most setups look like this chain:
Device → (optional) Gateway → Cloud backend → Mobile app
- Device: measures telemetry (temperature, battery, errors) and receives commands (restart, change interval).
- Gateway: aggregates local devices (BLE/Zigbee/Modbus), buffers data, and bridges to the internet.
- Cloud: authenticates devices/users, stores time-series history, triggers alerts, and exposes APIs.
- Mobile app: shows current status, history, and incidents; sends user commands.
Direct-to-cloud vs gateway-based
Direct-to-cloud devices work best when devices have reliable IP connectivity (Wi‑Fi/LTE) and enough power/CPU.
- Pros: fewer moving parts, simpler operations, lower latency.
- Cons: each device must handle secure connectivity, updates, and intermittent networks.
Gateway-based architectures fit constrained devices or industrial setups.
- Pros: gateways can buffer during outages, translate protocols, and reduce cellular costs by batching.
- Cons: extra hardware to manage; gateway failure can affect many devices.
REST/HTTP vs WebSockets vs MQTT (high level)
- REST/HTTP: great for configuration, device lists, “get latest status,” and occasional commands. Simple and widely supported.
- WebSockets: ideal for the mobile app to receive live updates while the app is open (streaming status changes).
- MQTT: commonly used between devices/gateways and cloud for frequent telemetry over unreliable networks; lightweight publish/subscribe.
A common split is MQTT for device→cloud, and WebSockets + REST for cloud→mobile.
A copyable data flow diagram
[Device Sensors]
     |
     | telemetry (MQTT/HTTP)
     v
[Gateway - optional] ---- local protocols (BLE/Zigbee/Serial)
     |
     | secure uplink (MQTT/HTTP)
     v
[Cloud Ingest] -> [Rules/Alerts] -> [Time-Series Storage]
     |
     | REST (queries/commands) + WebSocket (live updates)
     v
[Mobile App Dashboard]
Pick the simplest architecture that still works under your worst network conditions—then design everything else (data model, alerts, UI) around that choice.
Device Connectivity and Lifecycle Management
A monitoring app is only as reliable as the way it identifies devices, tracks their state, and manages their “life” from onboarding to retirement. Good lifecycle management prevents mystery devices, duplicate records, and stale status screens.
Device identity and provisioning
Start with a clear identity strategy: every device must have a unique ID that never changes. This could be a factory serial number, a secure hardware identifier, or a generated UUID stored on the device.
During provisioning, capture minimal but useful metadata: model, owner/site, install date, and capabilities (e.g., has GPS, supports OTA updates). Keep provisioning flows simple—scan a QR code, claim the device, and confirm it shows up in the fleet.
Device state model (what “status” really means)
Define a consistent state model so the mobile app can display real-time device status without guessing:
- Online/offline: based on heartbeat or last message time.
- Last seen: timestamp, plus where it was last connected (if relevant).
- Firmware version: so you can detect outdated devices.
- Battery: last reported level and charging state (if applicable).
Make the rules explicit (e.g., “offline if no heartbeat for 5 minutes”) so support and users interpret the dashboard the same way.
Command-and-control basics
Commands should be treated as tracked tasks:
- Send command (with a unique command ID)
- Confirm receipt (device acknowledges)
- Report result (success/failure + details)
This structure helps you show progress in the app and prevents “did it work?” confusion.
Handling unreliable networks
Devices will disconnect, roam, or sleep. Design for it:
- Retries and timeouts: retry with backoff; show “pending” when appropriate.
- Idempotency: repeated requests with the same command ID should not execute twice.
- Graceful failure: store commands for later delivery when the device reconnects.
When you manage identity, state, and commands this way, the rest of your remote device monitoring app becomes far easier to trust and operate.
Backend, Storage, and APIs for Monitoring Data
Your backend is the “control room” for a remote device monitoring app: it receives telemetry, stores it efficiently, and serves fast, predictable APIs to the mobile app.
Core backend services
Most teams end up with a small set of services (separate codebases or well-separated modules):
- Ingestion API: accepts device telemetry (often via MQTT/HTTP gateways), validates payloads, timestamps events, and queues work.
- Device registry: the source of truth for device identity, metadata (model, firmware, site), and current lifecycle state (provisioned, active, retired).
- User management: organizations, roles, permissions, and audit logging—so the right people see the right fleets.
Picking storage: time-series vs relational
- Time-series storage (or a time-series optimized table/index) is best for high-volume telemetry: fast inserts, time-range queries, and efficient charting.
- Relational storage is ideal for “business data”: users, devices, locations, alert rules, maintenance tickets, and access control.
Many systems use both: relational for control data, time-series for telemetry.
Aggregation and downsampling
Mobile dashboards need charts that load quickly. Store raw data, but also precompute:
- Rollups (e.g., 1-min, 15-min, 1-hour averages/min/max)
- Downsampled series for long date ranges
- Last-known status per device (a compact record the app can fetch instantly)
APIs your app will actually call
Keep APIs simple and cache-friendly:
GET /devices(list + filters like site, status)GET /devices/{id}/status(last-known state, battery, connectivity)GET /devices/{id}/telemetry?from=&to=&metric=(history queries)GET /alertsandPOST /alerts/rules(view and manage alerting)
Design responses around the mobile UI: prioritize “what’s the current status?” first, then allow deeper history when users drill in.
Real-Time Updates Without Draining Battery
“Real-time” in a remote device monitoring app rarely means “every millisecond.” It usually means “fresh enough to act,” without keeping the radio awake or hammering your backend.
Polling vs. streaming: pick the lightest tool that works
Polling (the app periodically asks the server for the latest status) is simple and battery-friendly when updates are infrequent. It’s often enough for dashboards viewed a few times per day, or when devices report every few minutes.
Streaming updates (the server pushes changes to the app) feel instant, but they keep a connection open and can increase power use—especially on unreliable networks.
A practical approach is hybrid: poll in the background at a low rate, then switch to streaming only when the user is actively watching a screen.
When WebSockets make sense (and when they don’t)
Use WebSockets (or similar push channels) when:
- Operators need to watch a device’s state change live (e.g., alarms, door open/close events).
- You’re displaying fast-moving metrics during troubleshooting.
- You can scope it to “foreground only” and disconnect when the app is idle.
Stick with polling when:
- Users mostly need the latest known status, not every intermediate change.
- Networks are spotty (reconnect loops can waste power).
- The app is frequently in the background.
Design for scale: reduce chatter before it hurts
Battery and scale problems often share the same root: too many requests.
Batch updates (fetch multiple devices in one call), paginate long histories, and apply rate limits so a single screen can’t accidentally request hundreds of devices every second. If you have high-frequency telemetry, downsample for mobile (e.g., 1 point per 10–30 seconds) and let the backend aggregate.
Make freshness obvious in the UI
Always show:
- Last updated timestamp per device (and per widget if needed)
- Connection status (online/offline/unknown)
- A clear distinction between live data and cached data
This builds trust and prevents users from acting on stale “real-time device status.”
Alerts, Notifications, and Incident Workflow
Alerts are where a remote device monitoring app earns trust—or loses it. The goal isn’t “more notifications”; it’s getting the right person to take the right action with enough context to fix the issue quickly.
Alert types that matter
Start with a small set of alert categories that map to real operational problems:
- Threshold alerts: a metric crosses a limit (temperature, battery, error rate). Use separate “warning” and “critical” levels when it changes what you want someone to do.
- Anomaly flags: a service detects unusual behavior (sudden power spikes, sensor stuck values). These are useful, but only if the app shows why it was flagged.
- Offline / heartbeat missed: the device hasn’t checked in. Treat this differently from “bad data,” and include the last-seen time plus recent connectivity history.
Notification channels (and when to use them)
Use in-app notifications as the complete record (searchable, filterable). Add push notifications for time-sensitive issues, and consider email/SMS only for high-severity or after-hours escalation. Push should be brief: device name, severity, and one clear action.
Alert noise control
Noise kills response rates. Build in:
- Cooldowns (don’t re-alert every minute)
- Deduplication (group repeated failures into a single incident)
- Escalation rules (if unacknowledged for X minutes, notify the next on-call)
Incident workflow and audit trail
Treat alerts as incidents with states: Triggered → Acknowledged → Investigating → Resolved. Every step should be recorded: who acknowledged, when, what changed, and optional notes. This audit trail helps with compliance, postmortems, and tuning thresholds so your /blog/monitoring-best-practices section can be based on real data later.
Mobile UI: Dashboards That Make Status Obvious
A monitoring app succeeds or fails on one question: can someone understand what’s wrong in a few seconds? Aim for glanceable screens that highlight exceptions first, with details one tap away.
Start with a device list that scales
Your home screen is usually a device list. Make it fast to narrow down a fleet:
- Search by device name, ID, or serial
- Filters for status (Online/Offline/Warning), model, firmware, and last-seen time
- Tags and grouping by site, customer, or building (e.g., “Warehouse A → Cold Room 2”)
Use clear status chips (Online, Degraded, Offline) and show a single most important secondary line such as last heartbeat (“Seen 2m ago”).
Device detail view: tell a story
On the device detail screen, avoid long tables. Use status cards for the essentials:
- Connectivity (signal, last check-in)
- Power (battery, charging, voltage)
- Health (fault codes, temperature, uptime)
Add a Recent events panel with human-readable messages (“Door opened”, “Firmware update failed”) and timestamps. If commands are available, keep them behind an explicit action (e.g., “Restart device”) with confirmation.
Charts that people can read
Charts should answer “what changed?” not show off data volume.
Include a time range picker (1h / 24h / 7d / Custom), display units everywhere, and use readable labels (avoid cryptic abbreviations). When possible, annotate anomalies with markers that match your event log.
Accessibility and readability
Don’t rely on color alone. Pair color contrast with status icons and text (“Offline”). Increase tap targets, support Dynamic Type, and keep critical status visible even in bright light or low battery mode.
Security and Access Control for Remote Monitoring
Security isn’t a “later” feature for a remote device monitoring app. The moment you show real-time device status or allow remote commands, you’re handling sensitive operational data—and potentially controlling physical equipment.
Authentication: pick one clear path (magic links)
For most teams, magic link sign-in is a solid default: users enter an email, receive a time-limited link, and you avoid password reset headaches.
Keep the magic link short-lived (minutes), single-use, and tied to device/browser context when possible. If you support multiple orgs, make the org selection explicit so people don’t accidentally access the wrong fleet monitoring workspace.
Authorization: who can view vs control
Authentication proves who someone is; authorization defines what they can do. Use role-based access control (RBAC) with at least two roles:
- Viewer: can see device telemetry, history, and dashboards
- Operator/Admin: can send commands (restart device, change settings) and manage alerts
In practice, the riskiest action is “control.” Treat command endpoints as a separate permission set, even if the UI is a single button.
Data protection: transport, storage, and APIs
Use TLS everywhere—between mobile app and backend APIs, and between devices and ingestion services (MQTT vs HTTP doesn’t matter if it’s not encrypted).
On the phone, store tokens in the OS keychain/keystore, not in plain preferences. On the backend, design least-privilege APIs: a dashboard request shouldn’t return secret keys, and a device-control endpoint shouldn’t accept broad “do anything” payloads.
Operational security: audits and safe admin actions
Log security-relevant events (sign-ins, role changes, device command attempts) as audit events you can review later. For dangerous actions—like disabling a device, changing ownership, or muting push notifications for monitoring—add confirmation steps and visible attribution (“who did what, when”).
Testing with Realistic Device and Network Conditions
A remote device monitoring app can look perfect in the lab and still fail in the field. The difference is usually “real life”: flaky networks, noisy telemetry, and devices that do unexpected things. Testing should mirror those conditions as closely as possible.
Cover the right test layers
Start with unit tests for parsing, validation, and state transitions (for example, how a device moves from online to stale to offline). Add API tests that verify authentication, pagination, and filtering for device history.
Then run end-to-end tests for the most important user flows: opening a fleet dashboard, drilling into a device, viewing recent telemetry, sending a command, and confirming the result. These are the tests that catch broken assumptions between the mobile UI, backend, and device protocol.
Simulate devices and network behavior
Don’t rely only on a few physical devices. Build a fake telemetry generator that can:
- Emit realistic readings (including spikes and sensor “stuck” values)
- Toggle offline/online, including long gaps and reconnect storms
- Send acknowledgements or errors for commands
Pair this with network simulation on mobile: airplane-mode flips, packet loss, and switching between Wi‑Fi and cellular. The goal is to confirm your app stays understandable when data is late, partial, or missing.
Probe tricky edge cases
Remote monitoring systems regularly encounter:
- Clock skew between devices and server timestamps
- Duplicate messages (often after reconnect) that must not create double events
- Missing data points that should render as gaps, not misleading lines
Write focused tests that prove your history views, “last seen” labels, and alert triggers behave correctly under these conditions.
Check performance at fleet scale
Finally, test with large fleets and long date ranges. Verify the app remains responsive on slow networks and older phones, and that the backend can serve time-series history efficiently without forcing the mobile app to download more than it needs.
Launch, Operate, and Improve Over Time
Shipping a remote device monitoring app isn’t a finish line—it’s the start of running a service that people will rely on when something goes wrong. Plan for safe releases, measurable operations, and predictable change.
Release plan: staged rollout, feature flags, rollback
Start with a staged rollout: internal testers → a small pilot fleet → a larger percentage of users/devices → full release. Pair this with feature flags so you can enable new dashboards, alert rules, or connectivity modes per customer, per device model, or per app version.
Have a rollback strategy that covers more than the mobile app store:
- Backend rollback: keep your APIs backward-compatible for at least one release cycle.
- Config rollback: store alert thresholds and device policies as versioned configs you can revert.
- Kill switches: be able to disable a noisy alert type or a new real-time stream instantly.
Monitoring your monitoring
If your app reports device uptime but your ingestion pipeline is delayed, users will see “offline” devices that are actually fine. Track the health of the whole chain:
- Service uptime (API, MQTT/HTTP gateway, notification workers)
- Ingestion lag (time from device timestamp to availability in the app)
- Notification success (push delivery rate, open rate, time-to-acknowledge)
- Data gaps (missing telemetry per device cohort)
Maintenance: firmware, schemas, and versioning
Expect ongoing updates: firmware changes can alter telemetry fields, command capabilities, and timing. Treat telemetry as a versioned contract—add fields without breaking old ones, document deprecations, and keep parsers tolerant of unknown values. For command APIs, version endpoints and validate payloads by device model and firmware version.
Next steps and resources
If you’re planning budget and timelines, see /pricing. For deeper dives, explore topics like MQTT vs HTTP and time-series storage in /blog, then turn your learnings into a quarterly roadmap that prioritizes fewer, higher-confidence improvements.
If you want to accelerate early delivery, Koder.ai can be useful for turning the MVP requirements above (roles, device registry, alert workflow, dashboards) into a working web backend + UI and even a cross-platform mobile experience, with source code export and iterative changes driven by planning-mode specs—so your team can spend more time validating device workflows and less time on scaffolding.
FAQ
What does “success” look like for a remote device monitoring app?
Start by defining what “better monitoring” means for your team:
- Fewer unknown states (clear online/offline and last check-in)
- Faster response (lower time to acknowledge/resolve)
- Fewer failures (earlier intervention from trends)
Use these as acceptance criteria for the MVP so features are tied to operational outcomes, not nice-looking dashboards.
Which user roles should I design for first?
Typical roles map to different workflows:
- Operator/NOC: triage, filtering, acknowledging issues fast
- Admin: users/roles, provisioning rules, alert thresholds, audits
- Field tech: last-known status, offline-friendly details, verify recovery
- Viewer: read-only, limited scope, high-level health summaries
Design screens and permissions per role so you don’t force everyone into one workflow.
What should be in the MVP for a mobile monitoring app?
Include the core flow for seeing problems, understanding them, and acting:
- Device inventory with search + filters (site/status/model)
- Last-known status and “last seen” per device
- Basic charts for a few key metrics (battery/temp/signal)
- Alerts + push notifications with acknowledge/resolve
- Roles/permissions (at least viewer vs operator/admin)
Defer maps, advanced analytics, and custom dashboards until you’ve proven response time improves.
How do I decide what telemetry to collect and how often?
Make a data map per device model:
- Signals available (telemetry, logs, health checks, location)
- Units, expected ranges, and what “bad” looks like
- Required freshness (seconds vs minutes vs daily)
- What must be stored as raw vs aggregated
This prevents over-collecting (cost) or under-collecting (blind spots during incidents).
How long should I retain device telemetry data?
Use a tiered approach:
- Raw data short-term for investigations (e.g., 7–30 days)
- Rollups/aggregates long-term for charts (e.g., hourly for 12 months)
- A compact last-known status record per device for fast mobile loads
This keeps the app responsive while still supporting post-incident analysis.
Should I use direct-to-cloud devices or a gateway architecture?
Choose based on device constraints and network reality:
- Direct-to-cloud: best when devices have reliable IP connectivity and enough power/CPU; simpler and lower latency.
- Gateway-based: best for constrained devices or industrial protocols; gateways can buffer outages and translate protocols, but add a failure point.
Pick the simplest option that still works in your worst connectivity conditions.
Which protocols should I use: REST, WebSockets, or MQTT?
A common, practical split is:
- MQTT for device/gateway → cloud telemetry (lightweight, resilient)
- REST/HTTP for mobile queries/config and occasional commands
- WebSockets for live updates while the app is open
Avoid “always streaming” if users mostly need last-known status; hybrid (poll in background, stream in foreground) often works best.
How should command-and-control work in a monitoring app?
Treat commands as tracked tasks so users can trust outcomes:
- Send command with a unique command ID
- Device acknowledges receipt
- Device reports result (success/failure + details)
Add retries/timeouts and idempotency (same command ID won’t execute twice), and show states like pending vs delivered vs failed in the UI.
What’s the best way to handle offline devices and delayed sync?
Design for unreliable connectivity on both device and phone:
- Define what the device buffers vs drops
- Label delayed data clearly (e.g., “Last updated 18 min ago”)
- Use device timestamps (or server correction) to keep history accurate
- Make offline states explicit (online/offline/unknown) rather than guessing
The goal is clarity: users should immediately know when data is stale.
How do I secure a remote device monitoring app and control access?
Use RBAC and separate “view” from “control” capabilities:
- Viewer: read-only dashboards and history
- Operator/Admin: acknowledge incidents, manage alerts, send commands
Secure the full chain with TLS, store tokens in OS keychain/keystore, and keep an audit trail for sign-ins, role changes, and command attempts. Treat device-control endpoints as higher risk than status reads.