

How to Build a Web App for AI‑Powered Admin Dashboards
Step-by-step plan to design, build, and launch an admin dashboard web app with AI insights, secure access, reliable data, and measurable quality.
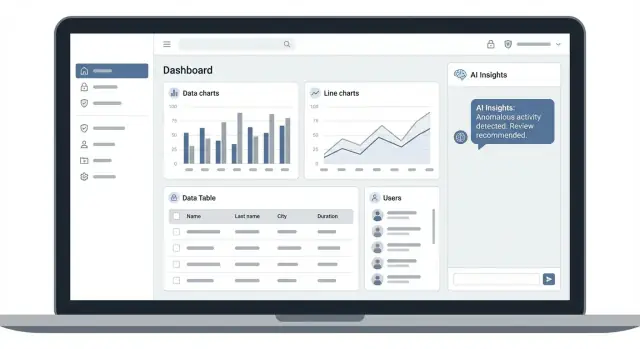
Define the dashboard’s purpose and AI value
Before you sketch charts or pick an LLM, get painfully clear about who this admin dashboard serves and what decisions it must support. Admin dashboards fail most often when they try to be “for everyone” and end up helping no one.
Start with the audience and their daily decisions
List the primary roles that will live in the dashboard—typically ops, support, finance, and product. For each role, write the top 3–5 decisions they make every day or week. Examples:
- Support: Which tickets need escalation? Are there emerging issue clusters?
- Ops: Are orders/shipments stuck? What needs intervention right now?
- Finance: Are refunds spiking? Any unusual payouts or chargebacks?
- Product: Which features are driving retention? Where are users getting stuck?
If a widget doesn’t help a decision, it’s probably noise.
Define what “AI-powered” means (in plain terms)
“AI-powered admin dashboard” should translate into a small set of concrete helpers, not a general chatbot bolted on. Common high-value AI features include:
- Summaries: Daily/weekly rollups of key changes, written in clear language.
- Anomaly flags: “This metric moved unusually” with a short explanation and links to the underlying rows.
- Search across systems: One query that finds users, orders, invoices, and related notes.
- Q&A with citations: Ask “Why did cancellations rise yesterday?” and get an answer that points to the exact charts, filters, or records used.
Decide what needs real-time vs. acceptable delay
Separate workflows that require instant updates (fraud checks, outages, stuck payments) from those that can refresh hourly or daily (weekly finance summaries, cohort reports). This choice drives complexity, cost, and the freshness of AI answers.
Write success metrics you can measure
Pick outcomes that indicate real operational value:
- Time to triage incidents (minutes saved)
- Fewer internal handoffs or duplicate tickets
- Faster resolution for top issue types
- Reduced time spent assembling weekly reports
If you can’t measure improvement, you can’t tell whether the AI features are helping—or just generating additional work.
Map data sources and a simple domain model
Before you design screens or add AI, get clear on what data your dashboard will actually rely on—and how that data fits together. A surprising amount of admin dashboard pain comes from mismatched definitions (“What counts as an active user?”) and hidden sources (“Refunds are in the billing tool, not the DB”).
Inventory the real data sources
Start by listing every place “truth” currently lives. For many teams that includes:
- Your primary database (users, accounts, orders)
- CRM (accounts, pipeline, customer notes)
- Billing provider (subscriptions, invoices, refunds)
- Support system (tickets, tags, CSAT)
- Product analytics/event stream (events, funnels)
- Logs/monitoring (errors, latency, incidents)
- Spreadsheets (often where finance/ops tracks exceptions)
Capture for each source: who owns it, how you access it (SQL, API, exports), and what the common keys are (email, account_id, external_customer_id). Those keys are what make joining data possible later.
Decide the core entities (your “admin nouns”)
Admin dashboards work best when they’re built around a small set of entities that show up everywhere. Typical ones include users, accounts, orders, tickets, and events. Don’t over-model—pick the few that admins actually search for and troubleshoot.
A simple domain model might look like:
- Account has many Users
- Account has many Orders (or Subscriptions)
- Account/User has many Tickets
- User generates Events
This isn’t about perfect database design. It’s about agreeing on what an admin is “looking at” when they open a record.
Define ownership and shared definitions
For each important field and metric, record who owns the definition. For example, Finance may own “MRR,” Support may own “First response time,” and Product may own “Activation.” When ownership is explicit, it’s easier to resolve conflicts and avoid quietly changing numbers.
Plan freshness, corrections, and backfills
Dashboards often combine data with different refresh needs:
- Real-time-ish: errors, queued jobs, payments failing
- Hourly/daily: revenue metrics, cohort tables, ticket trends
Also plan for late events and corrections (refunds posted later, delayed event delivery, manual adjustments). Decide how far back you’ll allow backfills, and how you’ll reflect corrected history so admins don’t lose trust.
Add a lightweight data dictionary
Create a simple data dictionary (a doc is fine) that standardizes naming and meaning. Include:
- Field name (and source)
- Human definition
- Allowed values / examples
- Update frequency
This becomes the reference point for both dashboard analytics and LLM integration later—because the AI can only be as consistent as the definitions it’s given.
Pick a practical tech stack and architecture
A good admin dashboard stack is less about novelty and more about predictable performance: fast page loads, consistent UI, and a clean path to add AI without tangling core operations.
Frontend: React/Vue + a component library
Pick a mainstream framework your team can hire for and maintain. React (with Next.js) or Vue (with Nuxt) are both great for admin panels.
Use a component library to keep design consistent and speed up delivery:
- React: MUI, Ant Design, or Chakra UI
- Vue: Vuetify or Naive UI
Component libraries also help with accessibility and standard patterns (tables, filters, modals), which matter more than custom visuals in admin panel UI.
Backend: choose REST or GraphQL—then commit
Both work, but consistency matters more than the choice.
- REST is straightforward for dashboards:
/users,/orders,/reports?from=...&to=.... - GraphQL can reduce over-fetching for complex screens, but adds operational overhead.
If you’re unsure, start with REST plus good query parameters and pagination. You can still add a GraphQL gateway later if needed.
Database + caching for fast dashboard analytics
For most AI-powered admin dashboard products:
- Primary DB: PostgreSQL (reliable, great for analytics-style queries)
- Cache: Redis for session data, permissions lookups, and frequently requested widgets
A common pattern is “cache the expensive widgets” (top KPIs, summary cards) with short TTLs so dashboards stay snappy.
Running AI calls: server-side + background jobs
Keep LLM integration on the server to protect keys and control data access.
- Synchronous AI calls for small tasks (e.g., “summarize this ticket thread”)
- Background jobs for heavier tasks (e.g., “generate weekly ops report”), using a queue like BullMQ/Celery
Where a platform can speed up the first version
If your goal is to get a credible admin dashboard MVP in front of operators quickly (with RBAC, tables, drill-down pages, and AI helpers), a vibe-coding platform like Koder.ai can shorten the build/iterate cycle. You can describe screens and workflows in chat, generate a React frontend with a Go + PostgreSQL backend, and then export the source code when you’re ready to take over the repo. Features like planning mode plus snapshots/rollback are also useful when you’re iterating on prompt templates and AI UI without breaking core operations.
Minimal architecture diagram
[Browser]
   |
   v
[Web App (React/Vue)]
   |
   v
[API (REST or GraphQL)] ---> [Auth/RBAC]
   |           |
   |           v
   |        [LLM Service]
   v
[PostgreSQL] <--> [Redis Cache]
   |
   v
[Job Queue + Workers] (async AI/report generation)
This setup stays simple, scales gradually, and keeps AI features additive rather than tangled into every request path.
Design admin UX that stays fast and clear
Admin dashboards live or die by how quickly someone can answer, “What’s wrong?” and “What should I do next?” Design the UX around real admin work, then make it hard to get lost.
Organize screens by jobs, not by data
Start with the top tasks admins perform each day (refund an order, unblock a user, investigate a spike, update a plan). Group navigation around those jobs—even if the underlying data spans multiple tables.
A simple structure that often works:
- Overview (health, key metrics, alerts)
- Manage (users, orders, content—whatever is acted on)
- Investigate (logs, events, anomalies)
- Settings (billing, roles, integrations)
Make frequent tasks one or two steps away
Admins repeat a few actions constantly: search, filter, sort, and compare. Design navigation so these are always available and consistent.
- Global search with clear scoping (e.g., Users / Orders / Tickets)
- Filters that are readable and easy to reset
- Saved views for recurring workflows (e.g., “Chargebacks last 7 days”, “New users flagged for review”)
Prefer tables + drill-down over “wall of charts”
Charts are great for trends, but admins often need the exact record. Use:
- Clear tables with key columns, sensible defaults, and sticky headers
- Drill-down pages for detail (timeline, related objects, actions)
- Export where it’s genuinely used (CSV for finance, logs for support)
Accessibility and states aren’t optional
Bake in basics early: sufficient contrast, visible focus states, and full keyboard navigation for table controls and dialogs.
Also plan empty/loading/error states for every widget:
- Empty: explain what it means and how to populate it
- Loading: show skeletons to prevent layout jump
- Error: show what failed, how to retry, and where to check permissions
When the UX stays predictable under pressure, admins trust it—and work faster.
Choose AI features that help admins, not distract them
Admins don’t open a dashboard to “chat with AI.” They open it to make decisions, resolve issues, and keep operations moving. Your AI features should remove repetitive work, shorten investigation time, and reduce errors—not add another surface area to manage.
Start with 3–5 high‑leverage features
Pick a small set of features that directly replace manual steps admins already do every day. Good early candidates are narrow, explainable, and easy to validate.
Examples that usually pay off quickly:
- Account health summary: auto-generate a one‑screen brief for a selected customer/account: usage trend, recent incidents, billing status, and “what changed.”
- Ticket triage: classify incoming tickets, extract key fields, suggest priority, and draft a first response for an agent to edit.
- KPI explanations: when a metric spikes or drops, generate a plain‑English explanation of likely drivers (based on available signals) and list supporting evidence.
Decide where AI writes vs. where it suggests
Use AI to write text when the output is editable and low-risk (summaries, drafts, internal notes). Use AI to suggest actions when you can keep a human in control (recommended next steps, links to relevant records, pre-filled filters).
A practical rule: if a mistake could change money, permissions, or customer access, AI should propose—never execute.
Make AI decisions inspectable
For every AI flag or recommendation, include a small “Why am I seeing this?” explanation. It should cite the signals used (for example: “3 failed payments in 14 days” or “error rate increased from 0.2% to 1.1% after release 1.8.4”). This builds trust and helps admins catch bad data.
Define refusal and “ask for more context” moments
Specify when AI must refuse (missing permissions, sensitive requests, unsupported operations) and when it should ask a clarifying question (ambiguous account selection, conflicting metrics, incomplete time range). This keeps the experience focused and prevents confident but unhelpful output.
Build the data pipeline for AI context
An admin dashboard already has data everywhere: billing, support, product usage, audit logs, and internal notes. An AI assistant is only as useful as the context you can assemble quickly, safely, and consistently.
Decide what context the AI actually needs
Start from the admin tasks you want to speed up (e.g., “Why was this account blocked?” or “Summarize recent incidents for this customer”). Then define a small, predictable set of context inputs:
- Recent events: last N logins, critical errors, failed payments, feature flags changes
- Account plan and status: plan tier, renewal date, limits, delinquency state
- Internal notes: latest admin notes, escalation tags, owner
If a field doesn’t change the AI’s answer, don’t include it.
Create a safe “AI context” payload
Treat context as a product API of its own. Build a server-side “context builder” that produces a minimal JSON payload per entity (account/user/ticket). Include only necessary fields, and strip or mask sensitive data (tokens, full card details, full addresses, raw message bodies).
Add metadata so you can debug and audit behavior:
context_versiongenerated_atsources: which systems contributed dataredactions_applied: what was removed or masked
Use retrieval when data is large or messy
Trying to stuff every ticket, note, and policy into the prompt won’t scale. Instead, store searchable content (notes, KB articles, playbooks, ticket threads) in an index and fetch only the most relevant snippets at request time.
A simple pattern:
- Build a query from the admin’s question + entity identifiers.
- Retrieve top results (with timestamps and titles).
- Pass short excerpts plus citations into the AI prompt.
This keeps prompts small and answers grounded in real records.
Plan for rate limits, timeouts, and retries
AI calls will fail sometimes. Design for it:
- Set strict timeouts and return a partial response if needed.
- Use idempotency keys for retries.
- Queue non-urgent requests (summaries, weekly recaps) instead of blocking the UI.
Cache AI outputs (with expiry)
Many admin questions repeat (“summarize account health”). Cache results per entity + prompt version, and expire based on business meaning (e.g., 15 minutes for live metrics, 24 hours for summaries). Always include “as of” timestamps so admins know how fresh the answer is.
Prompting patterns and safety guardrails
An admin dashboard is a high-trust environment: the AI sees operational data and can influence decisions. Good prompting is less about “clever wording” and more about predictable structure, strict boundaries, and traceability.
Use structured prompts (and enforce the output)
Treat every AI request like an API call. Provide inputs in a clear format (JSON or bullet fields) and require a specific output schema.
For example, ask for:
- Task: what to do (summarize, classify, draft a reply)
- Context: the exact records the model may use
- Output format: fields, length, and any required sections
This reduces “freeform creativity” and makes responses easier to validate before showing them in the UI.
Prompt templates you can standardize
Keep templates consistent across features:
- Instructions: role + goal (e.g., “You are an assistant for support admins.”)
- Allowed sources: “Use only the provided tickets and knowledge base excerpts.”
- Tone and length: short, neutral, action-oriented
- Action limits: “Do not execute changes; only propose steps.”
Guardrails that matter in admin tools
Add explicit rules: no secrets, no personal data beyond what’s provided, and no risky actions (deleting users, refunding, changing permissions) without human confirmation.
When possible, require citations: link each claim to a source record (ticket ID, order ID, event timestamp). If the model can’t cite it, it should say so.
Logging for audit and debugging (with redaction)
Log prompts, retrieved context identifiers, and outputs so you can reproduce issues. Redact sensitive fields (tokens, emails, addresses) and store access-controlled logs. This becomes invaluable when an admin asks, “Why did the AI suggest this?”
Security, roles, and audit trails
Admin dashboards concentrate power: one click can change pricing, delete users, or expose private data. For AI-powered dashboards, the stakes are higher—an assistant might suggest actions or generate summaries that influence decisions. Treat security as a core feature, not a layer you “add later.”
Start with RBAC from day one
Implement role-based access control (RBAC) early, while your data model and routes are still evolving. Define a small set of roles (for example: Viewer, Support, Analyst, Admin) and attach permissions to roles—not to individual users. Keep it boring and explicit.
A practical approach is to maintain a permissions matrix (even a simple table in your docs) that answers: “Who can see this?” and “Who can change this?” That matrix will guide both your API and UI, and it prevents accidental privilege creep as the dashboard grows.
Separate “view” vs. “edit” for sensitive actions
Many teams stop at “can access the page.” Instead, split permissions into at least two levels:
- View permissions: read-only access to metrics, user profiles, billing status, and AI-generated insights.
- Edit permissions: mutating actions like refunds, role changes, account suspension, data exports, and configuration changes.
This separation reduces risk when you need to grant broad visibility (e.g., support staff) without granting the ability to change critical settings.
Enforce permissions on the server (always)
Hide buttons in the UI for a better experience, but never rely on UI checks for security. Every endpoint must validate the caller’s role/permissions on the server:
- Validate permission per action (not just per route group).
- Re-check permissions for bulk operations and exports.
- For AI actions (e.g., “generate a report for this customer”), authorize the underlying data access the same way you would for manual reports.
Audit trails for accountability
Log “important actions” with enough context to answer who changed what, when, and from where. At minimum, capture: actor user ID, action type, target entity, timestamp, before/after values (or a diff), and request metadata (IP/user agent). Make audit logs append-only, searchable, and protected from edits.
Document expectations
Write down your security assumptions and operating rules (session handling, admin access process, incident response basics). If you maintain a security page, link it from the product docs (see /security) so admins and auditors know what to expect.
Backend APIs that support dashboards and AI workflows
Your API shape will either keep the admin experience snappy—or force the frontend to fight the backend on every screen. The simplest rule: design endpoints around what the UI actually needs (list views, detail pages, filters, and a few common aggregates), and keep response formats predictable.
Design endpoints around UI screens
For each main screen, define a small set of endpoints:
- List endpoints for tables:
GET /admin/users,GET /admin/orders - Detail endpoints for drill-down:
GET /admin/orders/{id} - Aggregates for dashboard cards/charts:
GET /admin/metrics/orders?from=...&to=...
Avoid “all-in-one” endpoints like GET /admin/dashboard that try to return everything. They tend to grow without limits, become hard to cache, and make partial UI updates painful.
Make tables predictable: pagination, sorting, filters
Admin tables live and die by consistency. Support:
- Pagination (
limit,cursororpage) - Sorting (
sort=created_at:desc) - Stable filters (
status=paid&country=US)
Keep filters stable over time (don’t silently change meanings), because admins will bookmark URLs and share views.
Use background jobs for heavy work (reports + AI)
Large exports, long-running reports, and AI generation should be asynchronous:
POST /admin/reports→ returnsjob_idGET /admin/jobs/{job_id}→ status + progressGET /admin/reports/{id}/downloadwhen ready
Same pattern works for “AI summaries” or “draft replies” so the UI stays responsive.
Return consistent, UI-friendly errors
Standardize errors so the frontend can display them clearly:
{ "error": { "code": "VALIDATION_ERROR", "message": "Invalid date range", "fields": { "to": "Must be after from" } } }
This also helps your AI features: you can surface actionable failures instead of vague “something went wrong.”
Frontend implementation for charts, tables, and AI panels
A great admin dashboard frontend feels modular: you can add a new report or AI helper without rebuilding the whole UI. Start by standardizing a small set of reusable blocks, then make their behavior consistent across the app.
Build reusable UI blocks
Create a core “dashboard kit” you can reuse on every screen:
- Table: sortable columns, column visibility, row actions, pagination, and an empty/loading state.
- Chart: one wrapper component that handles loading, no-data, tooltips, and export.
- Filter bar: search box, date range, multi-select filters, and “clear all”.
- Side panel: details drawer for a selected row, including related records and AI tools.
These blocks keep screens consistent and reduce one-off UI decisions.
Make state predictable (and shareable)
Admins often bookmark views and share links. Put key state in the URL:
- Filters and date ranges (e.g.,
?status=failed&from=...&to=...) - Sort order and page
- Selected entity (e.g.,
?orderId=123opens the side panel)
Add saved views (“My QA queue”, “Refunds last 7 days”) that store a named set of filters. This makes the dashboard feel faster because users don’t rebuild the same queries repeatedly.
AI panels with control and clarity
Treat AI output like a draft, not a final answer. In the side panel (or an “AI” tab), show:
- Regenerate (with a visible explanation of what will change)
- Copy and Insert into note
- Thumbs up/down + a short “why?” field
Always label AI content and show which records were used as context.
“Human override” for AI-assisted actions
If AI suggests an action (flag user, refund, block payment), require a review step:
- Preview the change
- Let the admin edit key fields
- Confirm with a reason (stored for audit)
Instrument key interactions
Track what matters: search usage, filter changes, exports, AI open/click-through, regenerate rate, and feedback. These signals help you refine UI and decide which AI features actually save time.
Testing and AI evaluation before launch
Testing an admin dashboard is less about pixel-perfect UI and more about confidence under real conditions: stale data, slow queries, imperfect inputs, and human “power users” who click fast.
End-to-end tests for critical flows
Start with a short list of workflows that must never break. Automate them end-to-end (browser + backend + database) so you catch integration bugs, not just unit-level issues.
Typical “must-pass” flows include login (with roles), global search, editing a record, exporting a report, and any approval/review action. Add at least one test that covers a realistic dataset size, because performance regressions often hide behind small fixtures.
Build a small AI evaluation set
AI features need their own test artifacts. Create a lightweight evaluation set: 20–50 prompts that mirror real admin questions, each paired with expected “good” answers and a few “bad” examples (hallucinations, policy violations, or missing citations).
Keep it versioned in your repo so changes to prompts, tools, or models can be reviewed like code.
Measure quality (and failure behavior)
Track a few simple metrics:
- Correctness: does the answer match the underlying data?
- Helpfulness: does it propose the next action an admin would take?
- Refusal accuracy: does it refuse when it should (missing permission, no data, sensitive request)?
Also test adversarial inputs (prompt injection attempts in user-generated fields) to ensure guardrails hold.
Fallbacks, privacy, and launch readiness
Plan for model downtime: disable AI panels, show plain analytics, and keep core actions usable. If you have a feature flag system, wire AI behind flags so you can roll back quickly.
Finally, review privacy: redact logs, avoid storing raw prompts that may include sensitive identifiers, and keep only what you need for debugging and evaluation. A simple checklist in /docs/release-checklist helps teams ship consistently.
Launch, monitor, and iterate safely
Launching an AI‑powered admin dashboard isn’t a single event—it’s a controlled transition from “works on my machine” to “trusted by operators.” The safest approach is to treat launch as an engineering workflow with clear environments, visibility, and a deliberate feedback loop.
Separate environments (dev → stage → prod)
Keep development, staging, and production isolated with different databases, API keys, and AI provider credentials. Staging should mirror production settings closely (feature flags, rate limits, background jobs), so you can validate real-world behavior without risking live operations.
Use configuration via environment variables and a consistent deployment process across environments. This makes rollbacks predictable and avoids “special-case” production changes.
If you’re using a platform that supports snapshots and rollback (for example, Koder.ai’s built-in snapshot flow), you can apply the same discipline to AI feature iterations: ship behind flags, measure, and roll back quickly if prompts or retrieval changes degrade admin trust.
Monitoring that matches how admins feel problems
Set up monitoring that tracks both system health and user experience:
- Errors: API exceptions, frontend crashes, permission failures
- Latency: key dashboard endpoints, slow queries, AI response time
- Job queues: backlog depth, retries, dead-letter volume
- AI call failures: timeouts, rate limits, invalid outputs, blocked responses
Add alerts for data freshness (e.g., “sales totals last updated 6+ hours ago”) and dashboard load times (e.g., p95 over 2 seconds). These two issues cause the most confusion for admins because the UI may look “fine” while the data is stale or slow.
Iterate safely after MVP
Ship a small MVP, then expand based on real usage: which reports get opened daily, which AI suggestions are accepted, where admins hesitate. Keep new AI features behind flags, run short experiments, and review metrics before widening access.
Next steps: publish an internal runbook in /docs, and if you offer tiers or usage limits, make them clear on /pricing.
FAQ
How do I define the purpose of an AI-powered admin dashboard before building anything?
Start by listing the primary admin roles (support, ops, finance, product) and the 3–5 decisions each role makes weekly. Then design widgets and AI helpers that directly support those decisions.
A good filter is: if a widget doesn’t change what someone does next, it’s likely noise.
What does “AI-powered” realistically mean for an admin dashboard?
It should mean a small set of concrete helpers embedded in workflows, not a generic chatbot.
Common high-value options:
- Summaries (daily/weekly rollups)
- Anomaly flags with short explanations
- Cross-system search (users, orders, invoices, notes)
- Q&A with citations that point to records, charts, or filters used
Which parts of the dashboard should be real-time vs. delayed?
Use real-time where someone must react immediately (fraud checks, outages, stuck payments). Use hourly/daily refresh for reporting-heavy workflows (finance summaries, cohort analysis).
This choice affects:
- Infrastructure complexity
- Cost (compute + LLM usage)
- How “fresh” AI answers can be
How do I map data sources so the dashboard doesn’t end up with conflicting numbers?
Start by inventorying every place “truth” lives:
- Primary DB
- CRM
- Billing provider
- Support system
- Product analytics/event stream
- Logs/monitoring
- Spreadsheets used for exceptions
For each, capture ownership, access method (SQL/API/export), and the join keys (account_id, external_customer_id, email). Those keys determine how well you can connect admin views and AI context.
What’s the simplest domain model for an admin dashboard that still scales?
Pick a small set of core entities admins actually search and troubleshoot (often: Account, User, Order/Subscription, Ticket, Event).
Write a simple relationship model (e.g., Account → Users/Orders; User → Events; Account/User → Tickets) and document metric ownership (e.g., Finance owns MRR).
This keeps screens and AI prompts grounded in shared definitions.
What tech stack and architecture works best for AI-powered admin dashboards?
A practical baseline is:
- Frontend: React (Next.js) or Vue (Nuxt) + a component library (MUI/Ant/Vuetify)
- API: REST (or GraphQL if you’re committed)
- DB: PostgreSQL
- Cache: Redis for expensive widgets and permission lookups
- Jobs: queue + workers (BullMQ/Celery) for exports, reports, and heavy AI tasks
Keep LLM calls server-side to protect keys and enforce access control.
How should I design the UX so admins can work quickly?
Design navigation around jobs, not tables. Keep frequent tasks (search/filter/sort/compare) always available.
Practical UI patterns:
- Tables + drill-down pages (admins need the exact row)
- Global search with clear scoping (Users / Orders / Tickets)
- Saved views for recurring workflows
- Strong empty/loading/error states so the UI stays predictable under pressure
Which AI features should I ship first (and which should I avoid)?
Build AI features that reduce repetitive work and shorten investigations:
- Account health summaries (usage, incidents, billing, “what changed”)
- Ticket triage (classify, extract fields, suggest priority, draft response)
- KPI explanations (likely drivers + supporting evidence)
Rule of thumb: if a mistake affects money, permissions, or access, AI should suggest, not execute.
How do I build AI context safely without stuffing everything into the prompt?
Create a server-side context builder that returns minimal, safe JSON per entity (account/user/ticket). Include only fields that change the answer, and mask sensitive data.
Add metadata for debugging and audits:
context_versiongenerated_atsourcesredactions_applied
For large text (tickets, notes, KB), use retrieval: fetch only relevant snippets and pass them with citations.
What security and auditing practices are essential for AI admin dashboards?
Implement RBAC early and enforce it on the server for every action (including AI-generated reports and exports).
Also add:
- Separate “view” vs “edit” permissions for sensitive operations
- Append-only audit logs capturing who/what/when (with diffs where possible)
- Redacted prompt/output logging for AI debugging
- Refusal rules for missing permissions, sensitive requests, or unsupported actions