

How to Build a Web App to Monitor Customer Adoption Health Scores
Learn how to build a web app that tracks product usage, calculates adoption health scores, and alerts teams to risk—plus dashboards, data models, and tips.
Define Goals and Adoption Signals
Before you build a customer adoption health score, decide what you want the score to do for the business. A score meant to trigger churn risk alerts will look different from one meant to guide onboarding, customer education, or product improvements.
Define what “adoption” means for your product
Adoption is not just “logged in recently.” Write down the few behaviors that truly indicate customers are reaching value:
- Activation: the first moment a user reaches a meaningful outcome (e.g., “invited a teammate,” “connected a data source,” “published a report”).
- Core actions: repeatable, high-signal behaviors that correlate with successful accounts (e.g., weekly exports, automation runs, dashboards viewed by multiple users).
- Retention: continued usage at the right cadence for your product (daily, weekly, monthly), ideally across more than one user in the account.
These become your initial adoption signals for feature usage analytics and later cohort analysis.
List the decisions your app should enable
Be explicit about what happens when the score changes:
- Who gets notified when an account drops below a threshold?
- What playbooks should be launched (outreach, training, support check-in)?
- Which insights should inform product adoption monitoring (friction points, underused features, time-to-value)?
If you can’t name a decision, don’t track the metric yet.
Identify users, roles, and time windows
Clarify who will use the customer success dashboard:
- CS managers need prioritization and account context.
- Product needs patterns, cohorts, and feature-level movement.
- Support needs recent activity around tickets and incidents.
- Leadership needs an understandable roll-up and trend.
Pick standard windows—last 7/30/90 days—and consider lifecycle stages (trial, onboarding, steady-state, renewal). This avoids comparing a brand-new account to a mature one.
Set success criteria
Define “done” for your health score model:
- Accuracy: does it predict risk and expansion signals better than your current approach?
- Explainability: can a CS rep explain why the score is high/low in one minute?
- Ease of use: does it save time and drive consistent actions?
These goals shape everything downstream: event tracking, scoring logic, and the workflows you build around the score.
Select Metrics for Your Health Score
Choosing metrics is where your health score becomes either a helpful signal or a noisy number. Aim for a small set of indicators that reflect real adoption—not just activity.
Start with product adoption signals
Pick metrics that show whether users are repeatedly getting value:
- Logins / active users: e.g., weekly active users (WAU) and the trend over the last 4–8 weeks.
- Active days: how many distinct days the account was active in a week/month (helps avoid “one big session” false positives).
- Feature depth: usage of your “value features” (the actions that correlate with success), not every button click.
- Integrations connected: especially if integrations increase switching costs or unlock key workflows.
- Seat utilization: percent of purchased seats that are invited, activated, and actually active.
Keep the list focused. If you can’t explain why a metric matters in one sentence, it’s probably not a core input.
Add business context (so scores aren’t unfair)
Adoption should be interpreted in context. A 3-seat team will behave differently than a 500-seat rollout.
Common context signals:
- Plan tier and feature entitlements
- Contract size / ARR band
- Lifecycle stage: trial vs newly paid vs renewal window
These don’t need to “add points,” but they help you set realistic expectations and thresholds by segment.
Decide leading vs. lagging indicators
A useful score mixes:
- Leading indicators (predict future success): increasing active days, onboarding completion, first integration connected.
- Lagging indicators (confirm outcomes): renewal, expansion, long-term retention.
Avoid over-weighting lagging metrics; they tell you what already happened.
Optional: qualitative inputs (use carefully)
If you have them, NPS/CSAT, support ticket volume, and CSM notes can add nuance. Use these as modifiers or flags—not as the foundation—because qualitative data can be sparse and subjective.
Create a simple data dictionary
Before you build charts, align on names and definitions. A lightweight data dictionary should include:
- Metric name (e.g.,
active_days_28d) - Clear definition (what counts, what doesn’t)
- Time window and refresh cadence
- Source system (product events, CRM, support)
This prevents “same metric, different meaning” confusion later when you implement dashboards and alerts.
Design an Explainable Health Score Model
An adoption score only works if your team trusts it. Aim for a model you can explain in one minute to a CSM and in five minutes to a customer.
Start simple: weighted points (before ML)
Begin with a transparent, rules-based score. Pick a small set of adoption signals (e.g., active users, key feature usage, integrations enabled) and assign weights that reflect your product’s “aha” moments.
Example weighting:
- Weekly active users per seat: 0–40 points
- Key feature usage frequency: 0–35 points
- Breadth of features used: 0–15 points
- Time since last meaningful activity: 0–10 points
Keep weights easy to defend. You can revisit them later—don’t wait for a perfect model.
Normalize to reduce bias
Raw counts punish small accounts and flatter large ones. Normalize metrics where it matters:
- Per seat (usage / licensed seats)
- By account age (new vs. mature accounts)
- By plan tier (feature availability)
This helps your customer adoption health score reflect behavior, not just size.
Define green/yellow/red with clear reasoning
Set thresholds (e.g., Green ≥ 75, Yellow 50–74, Red < 50) and document why each cutoff exists. Link thresholds to expected outcomes (renewal risk, onboarding completion, expansion readiness), and keep the notes in your internal docs or /blog/health-score-playbook.
Make it explainable: contributors and trend
Every score should show:
- The top 3 contributors (what helped/hurt)
- The change over time (last 7/30 days)
- A plain-language summary (“Feature X usage dropped 35% week-over-week”)
Plan for iteration: version the model
Treat scoring as a product. Version it (v1, v2) and track impact: Did churn risk alerts get more accurate? Did CSMs act faster? Store the score version with each calculation so you can compare results over time.
Instrument Product Events and Data Sources
A health score is only as trustworthy as the activity data behind it. Before you build scoring logic, confirm the right signals are captured consistently across systems.
Choose your event sources
Most adoption programs pull from a mix of:
- Frontend events (page views, clicks, feature interactions)
- Backend actions (API calls, jobs completed, records created)
- Billing (plan, renewals, payment status, seat counts)
- Support and success tools (tickets, CSAT, onboarding milestones)
A practical rule: track critical actions server-side (harder to spoof, less affected by ad blockers) and use frontend events for UI engagement and discovery.
Define a clear event schema
Keep a consistent contract so events are easy to join, query, and explain to stakeholders. A common baseline:
event_nameuser_idaccount_idtimestamp(UTC)properties(feature, plan, device, workspace_id, etc.)
Use a controlled vocabulary for event_name (for example, project_created, report_exported) and document it in a simple tracking plan.
Decide on SDK vs server-side (or both)
- SDK tracking is fast to ship and great for UI events.
- Server-side tracking is better for system-of-record actions.
Many teams do both, but ensure you don’t double-count the same real-world action.
Handle identity correctly
Health scores usually roll up to the account level, so you need reliable user→account mapping. Plan for:
- Users belonging to multiple accounts
- Account merges (acquisitions, workspace consolidation)
- Anonymized IDs for pre-login behavior (with a safe merge after signup)
Bake in data quality checks
At minimum, monitor missing events, duplicate bursts, and timezone consistency (store UTC; convert for display). Flag anomalies early so your churn risk alerts don’t fire because tracking broke.
Model Your Data and Storage
A customer adoption health score app lives or dies by how well you model “who did what, and when.” The goal is to make common questions fast to answer: How is this account doing this week? Which features are trending up or down? Good data modeling keeps scoring, dashboards, and alerts simple.
Core entities to model
Start with a small set of “source of truth” tables:
- Accounts: account_id, plan, segment, lifecycle stage, CSM owner
- Users: user_id, account_id, role/persona, created_at, status
- Subscriptions (or contracts): account_id, start/end, seats, MRR, renewal date
- Features: feature_id, name, category (activation, collaboration, admin, etc.)
- Events: event_id, account_id, user_id, feature_id (nullable), event_name, timestamp, properties
- Scores: account_id, score_date (or computed_at), overall_score, component scores, explanation fields
Keep these entities consistent by using stable IDs (account_id, user_id) everywhere.
Split storage: relational + analytics
Use a relational database (e.g., Postgres) for accounts/users/subscriptions/scores—things you update and join frequently.
Store high-volume events in a warehouse/analytics store (e.g., BigQuery/Snowflake/ClickHouse). This keeps dashboards and cohort analysis responsive without overloading your transactional DB.
Store aggregates for speed
Instead of recalculating everything from raw events, maintain:
- Daily account summaries (one row per account per day): active users, key event counts, last activity, adoption milestones
- Feature counters: per account/day/feature usage counts, unique users, time spent (if available)
These tables power trend charts, “what changed” insights, and health score components.
Retention, partitioning, and query performance
For large event tables, plan retention (e.g., 13 months raw, longer for aggregates) and partition by date. Cluster/index by account_id and timestamp/date to accelerate “account over time” queries.
In relational tables, index common filters and joins: account_id, (account_id, date) on summaries, and foreign keys to keep data clean.
Plan the Web App Architecture
Your architecture should make it easy to ship a trustworthy v1, then grow without a rewrite. Start by deciding how many moving parts you truly need.
Monolith vs. services (keep v1 simple)
For most teams, a modular monolith is the fastest path: one codebase with clear boundaries (ingestion, scoring, API, UI), a single deployable, and fewer operational surprises.
Move to services only when you have a clear reason—independent scaling needs, strict data isolation, or separate teams owning components. Otherwise, premature services increase failure points and slow iteration.
Define the core components
At a minimum, plan these responsibilities (even if they live in one app initially):
- Ingestion: receives product events (SDK, Segment, webhook, batch imports).
- Aggregation: turns raw events into daily/weekly usage facts per account/user.
- Scoring: computes the customer adoption health score and supporting explanations.
- API: serves scores, trends, and “why” insights to the UI and integrations.
- UI: customer success dashboard with account views, cohorts, and drill-down.
If you want to prototype this quickly, a vibe-coding approach can help you get to a working dashboard without over-investing in scaffolding. For example, Koder.ai can generate a React-based web UI and a Go + PostgreSQL backend from a simple chat description of your entities (accounts, events, scores), endpoints, and screens—useful for standing up a v1 that your CS team can react to early.
Scheduled jobs vs. streaming
Batch scoring (e.g., hourly/nightly) is usually enough for adoption monitoring and dramatically simpler to operate. Streaming makes sense if you need near-real-time alerts (e.g., sudden usage drop) or very high event volume.
A practical hybrid: ingest events continuously, aggregate/scoring on a schedule, and reserve streaming for a small set of urgent signals.
Environments, secrets, and non-functional needs
Set up dev/stage/prod early, with seeded sample accounts in stage to validate dashboards. Use a managed secrets store and rotate credentials.
Document requirements up front: expected event volume, score freshness (SLA), API latency targets, availability, data retention, and privacy constraints (PII handling and access controls). This prevents architecture decisions from being made too late—under pressure.
Build the Data Pipeline and Scoring Jobs
Your health score is only as trustworthy as the pipeline that produces it. Treat scoring like a production system: reproducible, observable, and easy to explain when someone asks, “Why did this account drop today?”
A simple pipeline: raw → validated → aggregates
Start with a staged flow that narrows the data into something you can safely score:
- Raw events: append-only ingestion from your app, mobile, integrations, and billing/CRM exports.
- Validated events: events that pass schema checks (required fields, correct types), identity checks (user → account mapping), and deduplication.
- Daily aggregates: rollups by account (and optionally workspace/team) like active users, key feature counts, time-to-value milestones, and trend deltas.
This structure keeps your scoring jobs fast and stable, because they operate on clean, compact tables instead of billions of raw rows.
Recalculation schedules and backfills
Decide how “fresh” the score needs to be:
- Hourly scoring works for high-touch motions where CSMs act quickly.
- Daily scoring is often enough for SMB/self-serve and keeps costs down.
Build the scheduler so it supports backfills (e.g., reprocessing the last 30/90 days) when you fix tracking, change weightings, or add a new signal. Backfills should be a first-class feature, not an emergency script.
Idempotency: avoid double-counting
Scoring jobs will be retried. Imports will be rerun. Webhooks will be delivered twice. Design for that.
Use an idempotency key for events (event_id or a stable hash of timestamp + user_id + event_name + properties) and enforce uniqueness at the validated layer. For aggregates, upsert by (account_id, date) so recomputation replaces prior results rather than adding to them.
Monitoring and anomaly checks
Add operational monitoring for:
- Job success/failure and retry counts
- Data lag (how far behind “now” your latest aggregates are)
- Volume anomalies (sudden drops/spikes in events, active users, key actions)
Even lightweight thresholds (e.g., “events down 40% vs 7-day average”) prevent silent breakages that would mislead the customer success dashboard.
Audit trails for every score
Store an audit record per account per scoring run: input metrics, derived features (like week-over-week change), model version, and final score. When a CSM clicks “Why?”, you can show exactly what changed and when—without reverse-engineering it from logs.
Create a Secure API for Health and Insights
Your web app lives or dies by its API. It’s the contract between your scoring jobs, your UI, and any downstream tools (CS platforms, BI, data exports). Aim for an API that is fast, predictable, and safe by default.
Core endpoints to support real workflows
Design endpoints around how Customer Success actually explores adoption:
- Account health:
GET /api/accounts/{id}/healthreturns the latest score, status band (e.g., Green/Yellow/Red), and last calculated timestamp. - Trends:
GET /api/accounts/{id}/health/trends?from=&to=for score over time and key metric deltas. - Drivers (“why”):
GET /api/accounts/{id}/health/driversto show top positive/negative factors (e.g., “weekly active seats down 35%”). - Cohorts:
GET /api/cohorts/health?definition=for cohort analysis and peer benchmarks. - Exports:
POST /api/exports/healthto generate CSV/Parquet with consistent schemas.
Filtering, pagination, and caching
Make list endpoints easy to slice:
- Filters:
plan,segment,csm_owner,lifecycle_stage, anddate_rangeare the essentials. - Pagination: use cursor-based pagination (
cursor,limit) for stability as data changes. - Caching: cache heavy queries (cohort rollups, trend series) and return
ETag/If-None-Matchto reduce repeat loads. Keep cache keys aware of filters and permissions.
Security with role-based access control
Protect data at the account level. Implement RBAC (e.g., Admin, CSM, Read-only) and enforce it server-side on every endpoint. A CSM should only see accounts they own; finance-oriented roles might see plan-level aggregates but not user-level details.
Always return explainability
Alongside the numeric customer adoption health score, return “why” fields: top drivers, affected metrics, and the comparison baseline (previous period, cohort median). This turns product adoption monitoring into action, not just reporting, and makes your customer success dashboard trustworthy.
Design Dashboards and Account Views
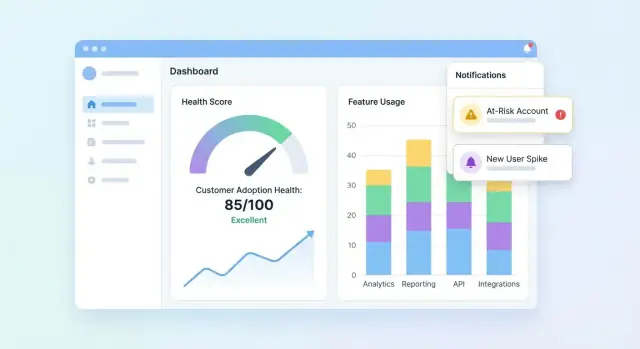
Your UI should answer three questions quickly: Who is healthy? Who is slipping? Why? Start with a dashboard that summarizes the portfolio, then let users drill into an account to understand the story behind the score.
Portfolio dashboard essentials
Include a compact set of tiles and charts that customer success teams can scan in seconds:
- Score distribution (histogram or buckets like Healthy / Watch / At-risk)
- At-risk list with the few fields needed to act (account, owner, score, last activity, top driver)
- Score trend over time (line chart) with the option to filter by segment
Make the at-risk list clickable so a user can open an account and immediately see what changed.
Account view: explain the score
The account page should read like a timeline of adoption:
- Timeline of key events (onboarding steps completed, integrations connected, admin changes, major feature first-use)
- Key metrics (active users, key feature actions, time since last meaningful activity)
- Feature adoption breakdown showing which features are adopted, ignored, or regressing
Add a “Why this score?” panel: clicking the score reveals the contributing signals (positive and negative) with plain-language explanations.
Cohort and segment views
Provide cohort filters that match how teams manage accounts: onboarding cohorts, plan tiers, and industries. Pair each cohort with trend lines and a small table of top movers so teams can compare outcomes and spot patterns.
Accessible, trustworthy visuals
Use clear labels and units, avoid ambiguous icons, and offer color-safe status indicators (e.g., text labels + shapes). Treat charts as decision tools: annotate spikes, show date ranges, and make drill-down behavior consistent across pages.
Add Alerts, Tasks, and Workflows
A health score is only useful if it drives action. Alerts and workflows turn “interesting data” into timely outreach, onboarding fixes, or product nudges—without forcing your team to stare at dashboards all day.
Define alert rules that map to real risk
Start with a small set of high-signal triggers:
- Score drops (e.g., down 15 points week-over-week)
- Red status (crossing a critical threshold)
- Sudden usage decline (key feature usage falls below a baseline)
- Failed onboarding step (stalled checklist item, integration not completed)
Make every rule explicit and explainable. Instead of “Bad health,” alert on “No activity in Feature X for 7 days + onboarding incomplete.”
Choose channels and keep them configurable
Different teams work differently, so build channel support and preferences:
- Email for account owners and managers
- Slack for team visibility and fast response
- In-app tasks inside your customer success dashboard so work doesn’t get lost
Let each team configure: who gets notified, which rules are enabled, and what thresholds mean “urgent.”
Reduce noise with guardrails
Alert fatigue kills adoption monitoring. Add controls like:
- Cooldown windows (don’t re-alert for the same account for N hours/days)
- Minimum data thresholds (skip alerts if the account has too little recent data)
- Batching/digests for non-urgent signals (daily/weekly summaries)
Add context and next steps
Each alert should answer: what changed, why it matters, and what to do next. Include recent score drivers, a short timeline (e.g., last 14 days), and suggested tasks like “Schedule onboarding call” or “Send integration guide.” Link to the account view (e.g., /accounts/{id}).
Track outcomes to close the loop
Treat alerts like work items with statuses: acknowledged, contacted, recovered, churned. Reporting on outcomes helps you refine rules, improve playbooks, and prove the health score is driving measurable retention impact.
Ensure Data Quality, Privacy, and Governance
If your customer adoption health score is built on unreliable data, teams will stop trusting it—and stop acting on it. Treat quality, privacy, and governance as product features, not afterthoughts.
Put automated data checks in place
Start with lightweight validation at every handoff (ingest → warehouse → scoring output). A few high-signal tests catch most issues early:
- Schema checks: expected columns exist, types haven’t changed, enums are valid.
- Range checks: impossible values (negative sessions, future timestamps) fail fast.
- Null checks: required fields (account_id, event_name, occurred_at) can’t be empty.
When tests fail, block the scoring job (or mark results as “stale”) so a broken pipeline doesn’t quietly generate misleading churn risk alerts.
Handle common edge cases explicitly
Health scoring breaks down on “weird but normal” scenarios. Define rules for:
- New accounts with little data: show “insufficient data” or use a ramp-up baseline rather than a low score.
- Seasonal usage: compare to the account’s prior period or cohort analysis benchmarks instead of a universal threshold.
- Outages and tracking gaps: flag affected windows and prevent penalizing customers for your downtime.
Add permissions and privacy controls
Limit PII by default: store only what you need for product adoption monitoring. Apply role-based access in the web app, log who viewed/exported data, and redact exports when fields aren’t required (e.g., hide emails in CSV downloads).
Create runbooks and governance habits
Write short runbooks for incident response: how to pause scoring, backfill data, and re-run historical jobs. Review customer success metrics and score weights regularly—monthly or quarterly—to prevent drift as your product evolves. For process alignment, link your internal checklist from /blog/health-score-governance.
Validate, Iterate, and Scale the Health Score
Validation is where a health score stops being a “nice chart” and starts being trusted enough to drive action. Treat your first version as a hypothesis, not a final answer.
Run a pilot and calibrate against human judgment
Start with a pilot group of accounts (for example, 20–50 across segments). For each account, compare the score and risk reasons against your CSM’s assessment.
Look for patterns:
- Scores that are consistently higher/lower than CSM judgment (calibration)
- “False alarms” (high risk but account is fine) vs “misses” (healthy score but account churns)
- Reasons that don’t match reality (explainability gaps)
Measure whether it’s actually useful
Accuracy is helpful, but usefulness is what pays off. Track operational outcomes such as:
- Time-to-detect risk (how early you flag an issue)
- Outreach success rate (percentage of risky accounts that improve after intervention)
- Churn-reduction proxies (renewal likelihood movements, expansion signals, support burden changes)
Test changes safely with versioning
When you adjust thresholds, weights, or add new signals, treat them as a new model version. A/B test versions on comparable cohorts or segments, and keep historical versions so you can explain why scores changed over time.
Collect feedback inside the UI
Add a lightweight control like “Score feels wrong” plus a reason (e.g., “recent onboarding completion not reflected,” “usage is seasonal,” “wrong account mapping”). Route this feedback to your backlog, and tag it to the account and score version for faster debugging.
Scale with a roadmap
Once the pilot is stable, plan scale-up work: deeper integrations (CRM, billing, support), segmentation (by plan, industry, lifecycle), automation (tasks and playbooks), and self-serve setup so teams can customize views without engineering.
As you scale, keep the build/iterate loop tight. Teams often use Koder.ai to spin up new dashboard pages, refine API shapes, or add workflow features (like tasks, exports, and rollback-ready releases) directly from chat—especially helpful when you’re versioning your health score model and need to ship UI + backend changes together without slowing down the CS feedback cycle.
FAQ
What should a customer adoption health score do for the business?
Start by defining what the score is for:
- Churn risk alerts (identify accounts slipping)
- Onboarding guidance (prioritize setup steps)
- Product improvement (spot friction and underused features)
If you can’t name a decision that changes when the score changes, don’t include that metric yet.
How do I define “adoption” for my product?
Write down the few behaviors that prove customers are getting value:
- Activation: the first meaningful outcome (e.g., invite a teammate, connect a data source)
- Core actions: repeatable actions correlated with successful accounts
- Retention cadence: continued usage weekly/monthly (ideally by multiple users)
Avoid defining adoption as “logged in recently” unless login directly equals value in your product.
Which metrics should I include in a health score?
Start with a small set of high-signal indicators:
- Weekly active users (WAU) and trend
- Active days (distinct days active, not just one long session)
- Key feature usage frequency (your “value features”)
- Integrations connected (when they unlock workflows or increase stickiness)
- Seat utilization (invited, activated, and active seats)
Only keep metrics you can justify in one sentence.
How do I keep the score fair across small and large accounts?
Normalize and segment so the same behavior is judged fairly:
- Normalize by seats (usage per licensed seat)
- Adjust expectations by account age (new vs. mature)
- Segment thresholds by plan tier/entitlements and ARR band
This prevents raw counts from punishing small accounts and flattering large ones.
What’s the difference between leading and lagging indicators in health scoring?
Leading indicators help you act early; lagging indicators confirm outcomes.
- Leading: increasing active days, onboarding completion, first integration connected
- Lagging: renewal, expansion, long-term retention
Use lagging indicators mainly for validation and calibration—don’t let them dominate the score if your goal is early warning.
How can I build an explainable scoring model without machine learning?
Use a transparent, weighted-points model first. Example components:
- WAU per seat (0–40)
- Key feature frequency (0–35)
- Breadth of features used (0–15)
- Time since last meaningful activity (0–10)
Then define clear status bands (e.g., Green ≥ 75, Yellow 50–74, Red < 50) and document why those cutoffs exist.
What product events should I instrument to power the score?
At a minimum, ensure each event includes:
event_name,user_id,account_id,timestamp(UTC)- Optional
properties(feature, plan, workspace_id, etc.)
Track critical actions server-side when possible, keep event_name in a controlled vocabulary, and avoid double-counting if you also instrument via an SDK.
How should I model and store data for a health score web app?
Model around a few core entities and split storage by workload:
- Relational DB (e.g., Postgres): accounts, users, subscriptions, scores
- Warehouse/analytics store: high-volume raw events
- Aggregates: daily account summaries and per-feature counters for fast trends
Partition large event tables by date, and index/cluster by account_id to speed up “account over time” queries.
How do I build scoring jobs that are reliable and debuggable?
Treat scoring as a production pipeline:
- Raw → validated → daily aggregates → score
- Make jobs idempotent (dedupe events; upsert aggregates by
(account_id, date)) - Support backfills for the last 30/90 days when tracking or weights change
- Store an audit record per run (inputs, derived metrics, model version, final score)
This makes “Why did the score drop?” answerable without digging through logs.
What API endpoints and alert rules should I build first?
Start with a few workflow-driven endpoints:
GET /api/accounts/{id}/health(latest score + status)GET /api/accounts/{id}/health/trends?from=&to=(time series + deltas)GET /api/accounts/{id}/health/drivers(top positive/negative contributors)
Enforce RBAC server-side, add cursor pagination for lists, and reduce noise in alerts with cooldown windows and minimum-data thresholds. Link alerts to the account view (e.g., /accounts/{id}).