Jul 14, 2025·6 min
Measure Before Optimizing: Paul Irish's Workflow for Speed
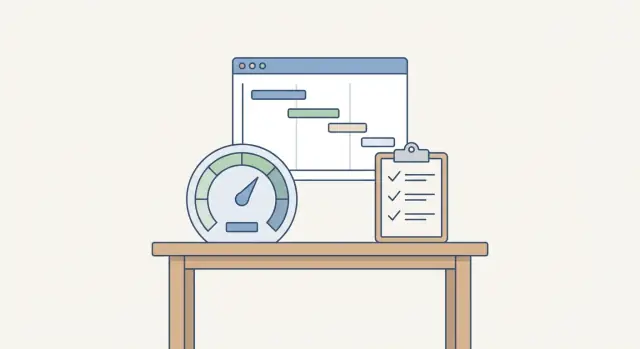
Use measure before optimizing as a simple loop: baseline, profile, change one thing, verify impact, and build a calmer performance habit.
Use measure before optimizing as a simple loop: baseline, profile, change one thing, verify impact, and build a calmer performance habit.
Performance work feels random when you start with fixes. One day you minify files, the next you tweak caching, then you remove a library. Sometimes it helps. Sometimes nothing changes, and you don’t know why.
The biggest risk is optimizing the wrong thing. If the page is slow because the main thread is blocked by JavaScript, spending hours compressing images may barely move the needle. Or you might speed up something users don’t notice while the real delay is a long API call, a layout that keeps reflowing, or a single blocking script.
There’s also a trap in judging by feel. “Feels faster” can come from placebo changes (like a spinner) or from testing on a different network, device, or time of day. “Is faster” means the same action, under the same conditions, produced better numbers.
A simple promise fixes most of this: measure before you optimize, then decide. When you treat performance like a measurement problem, you stop guessing and start learning.
A practical loop looks like this: pick one user action to improve, record a baseline under repeatable conditions, make one change you can explain, then re-measure and keep the change only if the numbers improve.
Paul Irish is one of the best-known voices in web performance. Through his work on browser tooling and performance guidance, he helped popularize a straightforward idea: your first job isn’t to guess what’s slow, it’s to prove it.
That mindset changes team dynamics. Instead of arguing from habits like “images are always the problem” or “it must be the framework,” you start with evidence. When you can point to a timeline, a slow query, or a long task, the conversation shifts from blame to fixes.
“Measure before optimizing” also cools off performance debates because it creates shared rules: agree on what you’re measuring, agree on what “better” means, and only celebrate when the numbers move.
This works on small sites and huge apps. A single baseline can stop random micro-optimizations on a marketing page. On a large product, consistent measurements keep performance from turning into a never-ending to-do list.
A simple way to make this real is to treat performance like a bug report: clear steps to reproduce, the metric you saw, and one change tied to one result. If two people disagree, rerun the measurement and let the data decide.
Treat performance like an instrumentation problem first: add ways to observe what users actually experience. If you can’t see it, you’ll end up debating opinions, not evidence. That’s the real meaning behind measuring first.
Instrumentation doesn’t need to be fancy. It’s collecting a few signals consistently, in the same places, so you can answer basic questions:
You usually want two kinds of data.
Lab data is captured in a controlled setup: a specific laptop or test device, a stable network profile, the same steps every run. It’s great for debugging because you can reproduce the slowdown on demand.
Real user data is what people experience in the wild: different devices, locations, and connection quality. It’s great for prioritizing because it shows what hurts actual users, not just one test run.
Even without being an expert, you can measure page load milestones (like first content shown), long tasks and main-thread blocking, slow network requests, expensive rendering work (layout, style, paint), and server response time.
Those signals typically live in a few places: browser developer tools for lab profiling, server logs and traces for backend timing, and analytics or RUM dashboards for real user data. For example, if checkout feels slow, DevTools might show the browser is busy rendering a huge cart UI while server logs show the API is fast. Without instrumentation, you might optimize the backend and never fix the real problem.
To measure before optimizing, you need a starting point you can trust. A baseline is the same action, measured the same way, under the same conditions.
Start with one real user journey, not “the whole site.” Pick something you can describe in one sentence, like “open the home page and scroll to the first product grid” or “log in and reach the dashboard.” Keeping it narrow makes the numbers steadier and the next steps clearer.
Next, pick 1 to 3 metrics that match the journey. For a page view, a common pair is LCP (how fast the main content appears) and TTFB (how fast the server responds). For a flow like checkout, you might track time to complete step 1 plus API response time for the payment call. Too many metrics makes it easy to cherry-pick.
Write down the test setup so someone else can reproduce it later. Small differences can swing results:
Finally, define “good enough” for your audience. For example: “LCP under 2.5s on a mid-range phone, on 4G.” If you use Koder.ai, taking a snapshot before testing helps keep your baseline tied to one known version.
Before you profile anything, make the problem happen again on demand. If you can’t repeat it, you can’t trust the result.
Start from what people feel, not what you assume. Is it a slow first render? A click that hangs before anything changes? A long wait after submitting a form? Pick the one moment users complain about and focus there.
Do a quick run to confirm the slowdown is real and repeatable. Keep everything else the same: same page, same device, same network if you can. Then write down the trigger and the exact moment it feels slow, like “after clicking Pay, the button freezes for a second” or “scrolling stutters when the product list appears.”
A simple way to keep it repeatable is a tiny script: open the page from a fresh tab, do the laggy action, note the exact point it slows down, then repeat once to confirm.
Capture one or two baseline recordings, not dozens. You want just enough evidence to say, “Yes, the slowdown happens, and it happens right here.”
Once you can reproduce the slowdown, stop guessing. Open a profiler (for most people, the browser’s Performance panel) and record one run of the slow interaction. The goal isn’t to find every issue. It’s to learn where the time goes.
Start with the biggest blocks of time. Tiny spikes can be real, but they rarely explain a noticeable delay on their own.
A useful way to read a recording is to group time into a few buckets: network and loading (waiting on requests), main thread scripting (long JavaScript tasks), rendering and paint (layout and style work), idle gaps (waiting on something else), and repeated work (the same expensive step happening again and again).
A common mistake is confusing a slow server response with slow client work. If the timeline shows long gaps while requests are in flight, your bottleneck may be network or backend. If it shows long tasks on the main thread, you have a front end problem even if the network is fast.
Before you change anything, write a short, testable hypothesis based on what you saw. For example: “The page feels slow because the main thread is blocked by JSON parsing right after the API response arrives.” That sentence sets up the next step.
After you’ve identified the likely bottleneck, resist the urge to “fix everything.” Change one variable so you can connect cause and effect.
Keep the change small and easy to undo. Big rewrites blur the result: if performance improves, you won’t know why. If it gets worse, rollback becomes risky.
Good one-thing changes are specific and testable. Examples include deferring or removing a single third-party script that blocks rendering, compressing one oversized image on the slow page, adding caching to one expensive database query, splitting one heavy UI component so it renders less work up front, or reducing work in one hot loop you saw in the profiler.
Before you touch code, write down what you changed, why you chose it, and what you expect to improve (for example, “reduce main-thread time” or “cut DB time in half”).
If your team uses a platform that supports snapshots and rollback (like Koder.ai), take a snapshot right before the change so “small and reversible” is real, not aspirational.
You changed one thing. Now prove it helped.
Re-run the exact same test setup you used for the baseline: same device, same browser version, same route and flow, and the same number of runs. Compare before vs after using the same metrics. Don’t add new metrics halfway through just because they look better.
Noise is the most common reason teams argue about performance. Watch for warm vs cold cache, extensions or background processes, different network conditions or VPN settings, server variance (quiet minute vs busy minute), and the difference between “right after deploy” and steady state.
If the median improves but the worst-case gets worse, that’s a real tradeoff. Decide what matters for your users, then document the decision: keep the change, revert it, or write a new hypothesis and test again.
Performance work gets confusing when you measure the wrong thing or change too much at once. You can burn a lot of effort without a clear win, even if your app is improving.
One common mistake is treating a single score as the goal. Scores can be useful, but users don’t experience “a 92.” They experience “the page shows content in 2 seconds” or “tapping Buy responds right away.” Pick one user-visible outcome and measure it consistently.
Another trap is testing only on a powerful laptop. Many slowdowns show up on mid-range phones, spotty networks, or when the CPU is busy. If you only profile on the best device you own, you can miss the bottleneck.
Confusion usually comes from patterns like improving what’s easiest instead of what takes the most time, bundling several tweaks into one change, switching test paths each time, skipping a re-test because it feels faster, or declaring victory without rerunning the same baseline.
If you’re building the app with a chat-driven platform like Koder.ai, the same discipline still applies: one change, then verify on the exact same flow so you can trust the result.
If you keep one habit, keep this one: measure before optimizing. The goal isn’t endless data. It’s a repeatable loop you can trust.
Name the exact user journey you care about. “Homepage is slow” is vague. “From product page to clicking Buy to seeing the confirmation” gives you a click path you can repeat.
Use this checklist:
The calm version of performance work is simple: one path, one setup, one change, one verified outcome.
A common complaint: checkout feels slow right after a customer clicks “Pay.” People start guessing (images, fonts, the button). Instead, treat it like a test you can repeat.
Set a baseline you can rerun. Pick one device and one path (cart -> checkout -> Pay -> confirmation). Turn on network throttling (for example, Fast 3G) and keep it the same every run. Measure one simple number: time from clicking “Pay” to seeing the confirmation screen.
Then profile that same moment and look for where the time goes. You’re usually deciding between three buckets: network (a long request or too many requests), server (the payment call is slow even while the browser is idle), or main thread (the browser is busy running JavaScript and can’t update the UI).
Imagine the profile shows that after clicking “Pay,” the browser fires an analytics request and a fraud-check script call, and the payment request waits behind them. That’s not a “make everything faster” problem. It’s one blocking step.
Make one change on purpose. For example, let the payment request start immediately, and send analytics only after the confirmation screen is shown.
Verify with the same setup: same throttling, same steps, multiple runs. If confirmation time drops and errors don’t increase, you’ve got a real win. Also spot-check that you didn’t break refunds, retries, or double-submit protection.
Performance stays sane when it’s a routine, not a rescue mission. Make measuring the default action, even when everything feels fine.
Pick a small set of metrics your team will always track. Keep it consistent so trends are easy to spot:
Build a loop around those metrics. A weekly baseline check is often enough. When a metric drifts, that’s your trigger to reproduce the slowdown, profile it, make one change, and verify impact.
Keep a simple performance log in whatever format your team actually uses. Record what you measured (including device, network, and build), what you changed, and what the numbers did after.
If you build with Koder.ai, Planning Mode can help you write down the user journey and the metric you care about before you change anything. Then use snapshots and rollback to keep experiments safe: snapshot, apply one change, re-test, and roll back if the result is noisy or worse.
In planning or review, one question keeps the culture healthy: “What did we measure, and what did it change?”
Because you can easily spend hours improving something that isn’t causing the delay. Start by proving where time is going (network, server, main thread, rendering), then target the biggest bottleneck.
Write down one specific action and the exact conditions, then repeat it:
If you can’t repeat it, you can’t trust it.
Pick 1–3 metrics that match what users notice:
Lab data is controlled and repeatable (great for debugging). Real user data reflects actual devices and networks (great for prioritizing).
A good default is: use real user data to find the worst journeys, then use lab profiling to explain why they’re slow and test fixes safely.
Treat it like a bug report:
This moves the conversation from opinions (“it must be images”) to evidence.
Record the slow interaction in a profiler and look for the biggest chunk of time:
Then write a one-sentence hypothesis you can test.
It keeps cause and effect clear. If you change five things and the page is faster, you won’t know what worked. If it’s slower, rollback is messy.
A practical rule: one change you can explain, one metric you expect to move, then re-measure.
Do the same test setup and compare before/after using the same metrics.
To reduce noise:
Keep the change only if the numbers improve in the same conditions.
Common traps:
Stick to one journey, one setup, and one verified outcome.
Use them to make experiments safe and comparable:
The tools help, but the real win is the repeatable loop: baseline → profile → one change → verify.
Avoid tracking too many numbers at once or you’ll cherry-pick.