Jul 14, 2025·8 min
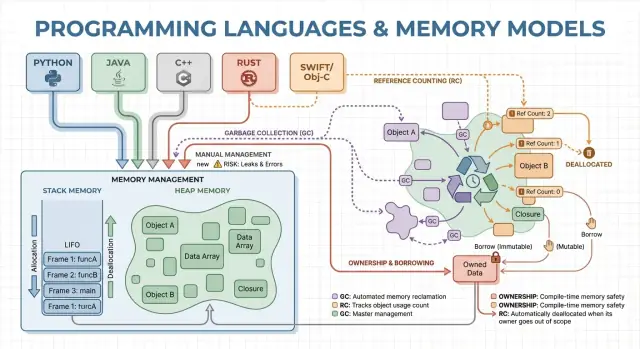
Memory Management Strategies: Performance vs Safety in Languages
Learn how garbage collection, ownership, and reference counting affect speed, latency, and security—and how to choose a language that fits your goals.
Learn how garbage collection, ownership, and reference counting affect speed, latency, and security—and how to choose a language that fits your goals.
Memory management is the set of rules and mechanisms a program uses to request memory, use it, and give it back. Every running program needs memory for things like variables, user data, network buffers, images, and intermediate results. Because memory is limited and shared with the operating system and other applications, languages must decide who is responsible for freeing it and when that happens.
Those decisions shape two outcomes most people care about: how fast a program feels, and how reliably it behaves under pressure.
Performance isn’t a single number. Memory management can affect:
A language that allocates quickly but sometimes pauses to clean up may look great in benchmarks but feel jittery in interactive apps. Another model that avoids pauses may require more careful design to prevent leaks and lifetime mistakes.
Safety is about preventing memory-related failures, such as:
Many high-profile security issues trace back to memory mistakes like use-after-free or buffer overflows.
This guide is a non-technical tour of the main memory models used by popular languages, what they optimize for, and the trade-offs you’re accepting when you pick one.
Memory is where your program keeps data while it runs. Most languages organize this around two main areas: the stack and the heap.
Think of the stack like a neat pile of sticky notes used for the current task. When a function starts, it gets a small “frame” on the stack for its local variables. When the function ends, that whole frame is removed at once.
This is fast and predictable—but it only works for values whose size is known and whose lifetime ends with the function call.
The heap is more like a storage room where you can keep objects for as long as you need. It’s great for things like dynamically sized lists, strings, or objects shared across different parts of a program.
Because heap objects can outlive a single function, the key question becomes: who is responsible for freeing them, and when? That responsibility is the “memory management model” of a language.
A pointer or reference is a way to access an object indirectly—like having the shelf number for a box in the storage room. If the box is thrown away but you still have the shelf number, you might read garbage data or crash (a classic use-after-free bug).
Imagine a loop that creates a customer record, formats a message, and discards it:
Some languages hide these details (automatic cleanup), while others expose them (you explicitly free memory, or you must follow rules about who owns an object). The rest of this article explores how those choices affect speed, pauses, and safety.
Manual memory management means the program (and therefore the developer) explicitly asks for memory and later releases it. In practice that looks like malloc/free in C, or new/delete in C++. It’s still common in systems programming where you need precise control over when memory is acquired and returned.
You typically allocate memory when an object must outlive the current function call, grows dynamically (e.g., a resizable buffer), or needs a specific layout for interoperability with hardware, operating systems, or network protocols.
With no garbage collector running in the background, there are fewer surprise pauses. Allocation and deallocation can be made highly predictable, especially when paired with custom allocators, pools, or fixed-size buffers.
Manual control can also reduce overhead: there’s no tracing phase, no write barriers, and often less metadata per object. When the code is carefully designed, you can hit tight latency targets and keep memory usage within strict limits.
The trade-off is that the program can make mistakes the runtime won’t automatically prevent:
These bugs can cause crashes, corrupted data, and security vulnerabilities.
Teams reduce risk by narrowing where raw allocation is allowed and leaning on patterns like:
std::unique_ptr) to encode ownershipManual memory management is often a strong choice for embedded software, real-time systems, OS components, and performance-critical libraries—places where tight control and predictable latency matter more than developer convenience.
Garbage collection (GC) is automatic memory cleanup: instead of requiring you to free memory yourself, the runtime tracks objects and reclaims those that are no longer reachable by the program. In practice, this means you can focus on behavior and data flow while the system handles most allocation and deallocation decisions.
Most collectors work by identifying live objects first, then reclaiming the rest.
Tracing GC starts from “roots” (like stack variables, global references, and registers), follows references to mark everything reachable, and then sweeps the heap to free unmarked objects. If nothing points to an object, it becomes eligible for collection.
Generational GC is based on the observation that many objects die young. It separates the heap into generations and collects the young area frequently, which is usually cheaper and improves overall efficiency.
Concurrent GC runs parts of collection alongside application threads, aiming to reduce long pauses. It may do more bookkeeping to keep the view of memory consistent while the program keeps running.
GC typically trades manual control for runtime work. Some systems prioritize steady throughput (lots of work completed per second) but may introduce stop-the-world pauses. Others minimize pauses for latency-sensitive apps but can add overhead during normal execution.
GC removes an entire class of lifetime bugs (especially use-after-free) because objects aren’t reclaimed while still reachable. It also reduces leaks caused by missed deallocations (though you can still “leak” by keeping references longer than intended). In large codebases where ownership is hard to track manually, this often speeds up iteration.
Garbage-collected runtimes are common in the JVM (Java, Kotlin), .NET (C#, F#), Go, and JavaScript engines in browsers and Node.js.
Reference counting is a memory management strategy where each object tracks how many “owners” (references) point to it. When the count drops to zero, the object is freed immediately. That immediacy can feel intuitive: as soon as nothing can reach an object, its memory is reclaimed.
Every time you copy or store a reference to an object, the runtime increments its counter; when a reference goes away, it decrements. Hitting zero triggers cleanup right then.
This makes resource management straightforward: objects often release memory close to the moment you stop using them, which can reduce peak memory usage and avoid delayed reclamation.
Reference counting tends to have steady, constant overhead: increment/decrement operations happen on many assignments and function calls. That overhead is usually small, but it’s everywhere.
The upside is that you typically don’t get large stop-the-world pauses like some tracing garbage collectors can cause. Latency is often smoother, though bursts of deallocation can still happen when large object graphs lose their last owner.
Reference counting can’t reclaim objects involved in a cycle. If A references B and B references A, both counts stay above zero even if nothing else can reach them—creating a memory leak.
Ecosystems handle this in a few ways:
Ownership and borrowing is a memory model most closely associated with Rust. The idea is simple: the compiler enforces rules that make it hard to create dangling pointers, double-frees, and many data races—without relying on a garbage collector at runtime.
Every value has exactly one “owner” at a time. When the owner goes out of scope, the value is cleaned up immediately and predictably. That gives you deterministic resource management (memory, file handles, sockets) similar to manual cleanup, but with far fewer ways to get it wrong.
Ownership can also move: assigning a value to a new variable or passing it into a function can transfer responsibility. After a move, the old binding can’t be used, which prevents use-after-free by construction.
Borrowing lets you use a value without becoming its owner.
A shared borrow allows read-only access and can be copied freely.
A mutable borrow allows updates, but must be exclusive: while it exists, nothing else can read or write that same value. This “one writer or many readers” rule is checked at compile time.
Because lifetimes are tracked, the compiler can reject code that would outlive the data it references, eliminating many dangling-reference bugs. The same rules also prevent a large class of race conditions in concurrent code.
The trade-off is a learning curve and some design constraints. You may need to restructure data flows, introduce clearer ownership boundaries, or use specialized types for shared mutable state.
This model is a strong fit for systems code—services, embedded, networking, and performance-sensitive components—where you want predictable cleanup and low latency without GC pauses.
When you create lots of short-lived objects—AST nodes in a parser, entities in a game frame, temporary data during a web request—the overhead of allocating and freeing each object one by one can dominate runtime. Arenas (also called regions) and pools are patterns that trade fine-grained frees for fast bulk management.
An arena is a memory “zone” where you allocate many objects over time, then release all of them at once by dropping or resetting the arena.
Instead of tracking each object’s lifetime individually, you tie lifetimes to a clear boundary: “everything allocated for this request,” or “everything allocated while compiling this function.”
Arenas are often fast because they:
This can improve throughput, and it can also reduce latency spikes caused by frequent frees or allocator contention.
Arenas and pools show up in:
The main rule is simple: don’t let references escape the region that owns the memory. If something allocated in an arena is stored globally or returned past the arena’s lifetime, you risk use-after-free bugs.
Languages and libraries handle this differently: some rely on discipline and APIs, others can encode the region boundary into types.
Arenas and pools aren’t an alternative to garbage collection or ownership—they’re often a supplement. GC languages commonly use object pools for hot paths; ownership-based languages can use arenas to group allocations and make lifetimes explicit. Used carefully, they deliver “fast by default” allocation without giving up clarity about when memory is released.
A language’s memory model is only part of the performance and safety story. Modern compilers and runtimes rewrite your program to allocate less, free sooner, and avoid extra bookkeeping. That’s why rules of thumb like “GC is slow” or “manual memory is fastest” often break down in real applications.
Many allocations only exist to pass data between functions. With escape analysis, a compiler can prove an object never outlives the current scope and keep it on the stack instead of the heap.
That can remove a heap allocation entirely, along with associated costs (GC tracking, reference count updates, allocator locks). In managed languages, this is a major reason small objects can be cheaper than you’d expect.
When a compiler inlines a function (replaces a call with the function body), it may suddenly “see through” layers of abstractions. That visibility enables optimizations like:
Well-designed APIs can become “zero-cost” after optimization, even if they look allocation-heavy in source code.
A JIT (just-in-time) runtime can optimize using real production data: which code paths are hot, typical object sizes, and allocation patterns. That often improves throughput, but it can add warm-up time and occasional pauses for recompilation or GC.
Ahead-of-time compilers must guess more up front, but they deliver predictable startup and steadier latency.
GC-based runtimes expose settings like heap sizing, pause-time targets, and generation thresholds. Adjust them when you have measured evidence (e.g., latency spikes or memory pressure), not as a first step.
Two implementations of the “same” algorithm can differ in hidden allocation counts, temporary objects, and pointer chasing. Those differences interact with optimizers, the allocator, and cache behavior—so performance comparisons need profiling, not assumptions.
Memory management choices don’t just change how you write code—they change when work happens, how much memory you need to reserve, and how consistent performance feels to users.
Throughput is “how much work per unit time.” Think of a nightly batch job that processes 10 million records: if garbage collection or reference counting adds small overhead but keeps the programmer productive, you may still finish fastest overall.
Latency is “how long one operation takes end-to-end.” For a web request, a single slow response hurts user experience even if average throughput is high. A runtime that occasionally pauses to reclaim memory can be fine for batch processing, but noticeable for interactive apps.
A larger memory footprint increases cloud costs and can slow programs down. When your working set doesn’t fit well in CPU caches, the CPU waits more often for data from RAM. Some strategies trade extra memory for speed (e.g., keeping freed objects in pools), while others reduce memory but add bookkeeping overhead.
Fragmentation happens when free memory is split into many small gaps—like trying to park a van in a lot with scattered tiny spaces. Allocators may spend more time searching for space, and memory can grow even when “enough” is technically free.
Cache locality means related data sits close together. Pool/arena allocation often improves locality (objects allocated together end up near each other), while long-lived heaps with mixed object sizes can drift into less cache-friendly layouts.
If you need consistent response times—games, audio apps, trading systems, embedded or real-time controllers—“mostly fast but occasionally slow” can be worse than “slightly slower but consistent.” This is where predictable deallocation patterns and tight control over allocations matter.
Memory errors aren’t just “programmer mistakes.” In many real systems, they turn into security problems: sudden crashes (denial of service), accidental data exposure (reading freed or uninitialized memory), or exploitable conditions where attackers steer a program into running unintended code.
Different memory-management strategies tend to fail in different ways:
Concurrency changes the threat model: memory that is “fine” in one thread can become dangerous when another thread frees or mutates it. Models that enforce rules around sharing (or require explicit synchronization) reduce the chance of race conditions that lead to corrupted state, data leaks, and intermittent crashes.
No memory model removes all risk—logic bugs (auth mistakes, insecure defaults, flawed validation) still happen. Strong teams layer protections: sanitizers in testing, safe standard libraries, careful code review, fuzzing, and strict boundaries around unsafe/FFI code. Memory safety is a major reduction in attack surface, not a guarantee.
Memory issues are easier to fix when you catch them close to the change that introduced them. The key is to measure first, then narrow down the problem with the right tool for the job.
Start by deciding whether you’re chasing speed or memory growth.
For performance, measure wall-clock time, CPU time, allocation rate (bytes/sec), and GC or allocator time. For memory, track peak RSS, steady-state RSS, and object counts over time. Run the same workload with consistent inputs; small variations can hide allocation churn.
Common signs: a single request allocates far more than expected, or memory climbs with traffic even when throughput is stable. Fixes often include reusing buffers, switching to arena/pool allocation for short-lived objects, and simplifying object graphs so fewer objects survive across cycles.
Reproduce with a minimal input, enable the strictest runtime checks (sanitizers/GC verification), then capture:
Treat the first fix as an experiment; re-run measurements to confirm the change reduced allocations or stabilized memory—without shifting the problem elsewhere. For more on interpreting trade-offs, see /blog/performance-trade-offs-throughput-latency-memory-use.
Choosing a language isn’t only about syntax or ecosystem—its memory model shapes day-to-day development speed, operational risk, and how predictable performance will be under real traffic.
Map your product needs to a memory strategy by answering a few practical questions:
If you’re switching models, plan for friction: calling into existing libraries (FFI), mixed memory conventions, tooling, and the hiring market. Prototypes help uncover hidden costs (pauses, memory growth, CPU overhead) earlier.
One practical approach is to prototype the same feature in the environments you’re considering and compare allocation rate, tail latency, and peak memory under a representative load. Teams sometimes do this kind of “apples-to-apples” evaluation in Koder.ai: you can quickly scaffold a small React front end plus a Go + PostgreSQL backend, then iterate on request shapes and data structures to see how a GC-based service behaves under realistic traffic patterns (and export the source code when you’re ready to take it further).
Define the top 3–5 constraints, build a thin prototype, and measure memory use, tail latency, and failure modes.
| Model | Safety by default | Latency predictability | Developer speed | Typical pitfalls |
|---|---|---|---|---|
| Manual | Low–Medium | High | Medium | leaks, use-after-free |
| GC | High | Medium | High | pauses, heap growth |
| RC | Medium–High | High | Medium | cycles, overhead |
| Ownership | High | High | Medium | learning curve |
Memory management is how a program allocates memory for data (like objects, strings, buffers) and then releases it when it’s no longer needed.
It impacts:
The stack is fast, automatic, and tied to function calls: when a function returns, its stack frame is removed all at once.
The heap is flexible for dynamic or long-lived data, but it needs a strategy for when and who frees it.
A common rule of thumb: stack is great for short-lived, fixed-size locals; heap is used when lifetimes or sizes are less predictable.
A reference/pointer lets code access an object indirectly. The danger is when the object’s memory is released but a reference to it is still used.
That can lead to:
You explicitly allocate and free memory (e.g., malloc/free, new/delete).
It’s useful when you need:
The cost is higher bug risk if ownership and lifetimes aren’t managed carefully.
Manual management can have very predictable latency if the program is designed well, because there’s no background GC cycle that might pause execution.
You can also optimize with:
But it’s easy to accidentally create expensive patterns too (fragmentation, allocator contention, lots of tiny alloc/free calls).
Garbage collection automatically finds objects that are no longer reachable and reclaims their memory.
Most tracing GCs work like this:
This usually improves safety (fewer use-after-free bugs) but adds runtime work and can introduce pauses depending on the collector design.
Reference counting frees an object when its “owner count” drops to zero.
Pros:
Cons:
Ownership/borrowing (notably Rust’s model) uses compile-time rules to prevent many lifetime mistakes.
Core ideas:
This can deliver predictable cleanup without GC pauses, but it often requires restructuring data flow to satisfy the compiler’s lifetime rules.
An arena/region allocates many objects into a “zone,” then frees them all at once by resetting or dropping the arena.
It’s effective when you have a clear lifetime boundary, like:
The key safety rule: don’t let references escape beyond the arena’s lifetime.
Start with real measurements under realistic load:
Then use targeted tools:
Many ecosystems use weak references or a cycle detector to mitigate cycles.
Tune runtime settings (like GC parameters) only after you can point to a measured problem.