Jul 18, 2025·8 min
How Observability and Slow Query Logs Protect Production
Learn how observability and slow query logs help detect, diagnose, and prevent production outages—plus practical steps to instrument, alert, and tune queries safely.
Learn how observability and slow query logs help detect, diagnose, and prevent production outages—plus practical steps to instrument, alert, and tune queries safely.
Production rarely “breaks” in one dramatic moment. More often it degrades quietly: a few requests start timing out, a background job slips behind, CPU creeps up, and customers are the first to notice—because your monitoring still shows “green.”
The user report is usually vague: “It feels slow.” That’s a symptom shared by dozens of root causes—database lock contention, a new query plan, a missing index, a noisy neighbor, a retry storm, or an external dependency that’s intermittently failing.
Without good visibility, teams end up guessing:
Many teams track averages (average latency, average CPU). Averages hide pain. A small percentage of very slow requests can ruin the experience while overall metrics look fine. And if you only monitor “up/down,” you’ll miss the long period where the system is technically up but practically unusable.
Observability helps you detect and narrow down where the system is degrading (which service, endpoint, or dependency). Slow query logs help you prove what the database is doing when requests stall (which query, how long it took, and often what kind of work it performed).
This guide stays practical: how to get earlier warning, connect user-facing latency to specific database work, and fix issues safely—without relying on vendor-specific promises.
Observability means being able to understand what your system is doing by looking at the signals it produces—without having to guess or “reproduce it locally.” It’s the difference between knowing users are experiencing slowness and being able to pinpoint where the slowness is happening and why it started.
Metrics are numbers over time (CPU %, request rate, error rate, database latency). They’re fast to query and great for spotting trends and sudden spikes.
Logs are event records with details (an error message, the SQL text, a user ID, a timeout). They’re best for explaining what happened in human-readable form.
Traces follow a single request as it moves through services and dependencies (API → app → database → cache). They’re ideal for answering where time was spent and which step caused the slowdown.
A useful mental model: metrics tell you something is wrong, traces show you where, and logs tell you what exactly.
A healthy setup helps you respond to incidents with clear answers:
Monitoring is usually about predefined checks and alerts (“CPU > 90%”). Observability goes further: it lets you investigate new, unexpected failure modes by slicing and correlating signals (for example, seeing only one customer segment experiencing slow checkouts, tied to a specific database call).
That ability to ask new questions during an incident is what turns raw telemetry into faster, calmer troubleshooting.
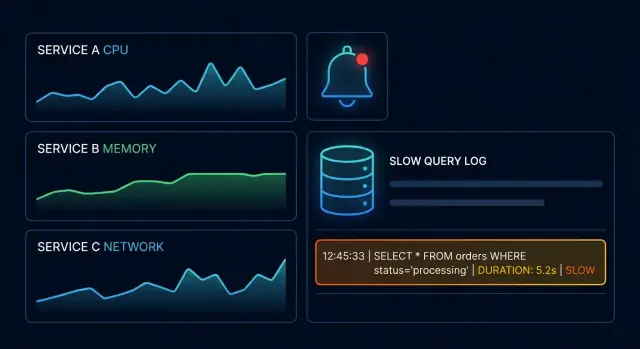
A slow query log is a focused record of database operations that exceeded a “slow” threshold. Unlike general query logging (which can be overwhelming), it highlights the statements most likely to cause user-visible latency and production incidents.
Most databases can capture a similar core set of fields:
That context is what turns “this query was slow” into “this query was slow for this service, from this pool of connections, at this exact time,” which is crucial when multiple apps share the same database.
Slow query logs are rarely about “bad SQL” in isolation. They’re signals that the database had to do extra work or got stuck waiting. Common causes include:
A helpful mental model: slow query logs capture both work (CPU/I/O heavy queries) and waiting (locks, saturated resources).
A single threshold (for example, “log anything over 500ms”) is simple, but it may miss pain when typical latency is much lower. Consider combining:
This keeps the slow query log actionable while your metrics surface trends.
Slow query logs can accidentally capture personal data if parameters are inlined (emails, tokens, IDs). Prefer parameterized queries and settings that log query shapes rather than raw values. When you can’t avoid it, add masking/redaction in your log pipeline before storing or sharing logs during incident response.
A slow query rarely stays “just slow.” The typical chain looks like this: user latency → API latency → database pressure → timeouts. The user feels it first as pages that hang or mobile screens that spin. Shortly after, your API metrics show elevated response times, even though the application code didn’t change.
From the outside, a slow database often appears as “the app is slow” because the API thread is blocked waiting for the query. CPU and memory on the app servers can look normal, yet p95 and p99 latency climb. If you only watch app-level metrics, you may chase the wrong suspect—HTTP handlers, caches, or deployments—while the real bottleneck is a single query plan that regressed.
Once a query drags, systems try to cope—and those coping mechanisms can amplify the failure:
Imagine a checkout endpoint that calls SELECT ... FROM orders WHERE user_id = ? ORDER BY created_at DESC LIMIT 1. After a data growth milestone, the index no longer helps enough, and the query time rises from 20ms to 800ms. Under normal traffic, it’s annoying. Under peak traffic, API requests pile up waiting for DB connections, time out at 2 seconds, and clients retry. Within minutes, a “small” slow query becomes user-visible errors and a full production incident.
When a database starts struggling, the first clues usually show up in a small set of metrics. The goal isn’t to track everything—it’s to spot a change fast, then narrow down where it’s coming from.
These four signals help you tell whether you’re seeing a database issue, an application issue, or both:
A few DB-specific charts can tell you whether the bottleneck is query execution, concurrency, or storage:
Pair DB metrics with what the service experiences:
Design dashboards to quickly answer:
When these metrics line up—tail latency rising, timeouts increasing, saturation climbing—you have a strong signal to pivot into slow query logs and tracing to pinpoint the exact operation.
Slow query logs tell you what was slow in the database. Distributed tracing tells you who asked for it, from where, and why it mattered.
With tracing in place, a “database is slow” alert becomes a concrete story: a specific endpoint (or background job) triggered a sequence of calls, one of which spent most of its time waiting on a database operation.
In your APM UI, start from a high-latency trace and look for:
GET /checkout or billing_reconcile_worker).Full SQL in traces can be risky (PII, secrets, huge payloads). A practical approach is to tag spans with a query name / operation rather than the full statement:
db.operation=SELECT and db.table=ordersapp.query_name=orders_by_customer_v2feature_flag=checkout_upsellThis keeps traces searchable and safe while still pointing you to the code path.
The fastest way to bridge “trace” → “app logs” → “slow query entry” is a shared identifier:
Now you can answer the high-value questions quickly:
Slow query logs are only useful when they stay readable and actionable. The goal isn’t “log everything forever”—it’s to capture enough detail to explain why queries are slow, without adding noticeable overhead or creating a cost problem.
Start with an absolute threshold that reflects user expectations and your database’s role in the request.
>200ms for OLTP-heavy apps, >500ms for mixed workloadsThen add a relative view so you still see problems when the whole system slows down (and fewer queries cross the hard line).
Using both avoids blind spots: absolute thresholds catch “always-bad” queries, while relative thresholds catch regressions during busy periods.
Logging every slow statement at peak traffic can hurt performance and generate noise. Prefer sampling (for example, log 10–20% of slow events) and increase sampling temporarily during an incident.
Make sure each event includes context you can act on: duration, rows examined/returned, database/user, application name, and ideally a request or trace ID if available.
Raw SQL strings are messy: different IDs and timestamps make identical queries look unique. Use query fingerprinting (normalization) to group similar statements, e.g., WHERE user_id = ?.
This lets you answer: “Which shape of query causes most latency?” instead of chasing one-off examples.
Keep detailed slow query logs long enough to compare “before vs after” during investigations—often 7–30 days is a practical starting point.
If storage is a concern, downsample older data (keep aggregates and top fingerprints) while retaining full-fidelity logs for the most recent window.
Alerts should signal “users are about to feel this” and tell you where to look first. The easiest way to do that is to alert on symptoms (what the customer experiences) and causes (what’s driving it), with noise controls so on-call isn’t trained to ignore pages.
Start with a small set of high-signal indicators that correlate with customer pain:
If you can, scope alerts to “golden paths” (checkout, login, search) so you’re not paging on low-importance routes.
Pair symptom alerts with cause-oriented alerts that shorten time to diagnosis:
These cause alerts should ideally include the query fingerprint, example parameters (sanitized), and a direct link into the relevant dashboard or trace view.
Use:
Every page should include “what do I do next?”—link a runbook like /blog/incident-runbooks and specify the first three checks (latency panel, slow query list, lock/connection graphs).
When latency spikes, the difference between a quick recovery and a long outage is having a repeatable workflow. The goal is to move from “something is slow” to a specific query, endpoint, and change that caused it.
Start with the user symptom: higher request latency, timeouts, or error rate.
Confirm with a small set of high-signal indicators: p95/p99 latency, throughput, and database health (CPU, connections, queue/wait time). Avoid chasing single-host anomalies—look for a pattern across the service.
Narrow the blast radius:
This scoping step keeps you from optimizing the wrong thing.
Open distributed traces for the slow endpoints and sort by longest duration.
Look for the span that dominates the request: a database call, a lock wait, or repeated queries (N+1 behavior). Correlate traces with context tags such as release version, tenant ID, and endpoint name to see whether the slowdown aligns with a deploy or a specific customer workload.
Now validate the suspected query in slow query logs.
Focus on “fingerprints” (normalized queries) to find the worst offenders by total time and count. Then note the affected tables and predicates (e.g., filters and joins). This is where you often discover a missing index, a new join, or a query plan change.
Pick the least risky mitigation first: rollback the release, disable the feature flag, shed load, or increase connection pool limits only if you’re sure it won’t amplify contention. If you must change the query, keep the change small and measurable.
One practical tip if your delivery pipeline supports it: treat “rollback” as a first-class button, not a hero move. Platforms like Koder.ai lean into this with snapshots and rollback workflows, which can reduce time-to-mitigation when a release accidentally introduces a slow query pattern.
Capture: what changed, how you detected it, the exact fingerprint, impacted endpoints/tenants, and what fixed it. Turn that into a follow-up: add an alert, a dashboard panel, and a performance guardrail (for example, “no query fingerprint over X ms at p95”).
When a slow query is already hurting users, the goal is to reduce impact first, then improve performance—without making the incident worse. Observability data (slow query samples, traces, and key DB metrics) tells you which lever is safest to pull.
Start with changes that reduce load without changing data behavior:
These mitigations buy time and should show immediate improvement in p95 latency and DB CPU/IO metrics.
Once stabilized, fix the actual query pattern:
EXPLAIN and confirm reduced rows scanned.SELECT *, add selective predicates, replace correlated subqueries).Apply changes gradually and confirm improvements using the same trace/span and slow query signature.
Rollback when the change increases errors, lock contention, or load shifts unpredictably. Hotfix when you can isolate the change (one query, one endpoint) and you have clear before/after telemetry to validate a safe improvement.
Once you’ve fixed a slow query in production, the real win is making sure the same pattern doesn’t return in a slightly different form. That’s where clear SLOs and a few lightweight guardrails turn one incident into lasting reliability.
Start with SLIs that map directly to customer experience:
Set an SLO that reflects acceptable performance, not perfect performance. For example: “p95 checkout latency under 600ms for 99.9% of minutes.” When the SLO is threatened, you have an objective reason to pause risky deploys and focus on performance.
Most repeat incidents are regressions. Make them easy to spot by comparing before/after for each release:
The key is to review changes in distribution (p95/p99), not just averages.
Pick a small set of “must not slow down” endpoints and their critical queries. Add performance checks to CI that fail when latency or query cost crosses a threshold (even a simple baseline + allowed drift). This catches N+1 query bugs, accidental full table scans, and unbounded pagination before they ship.
If you build services quickly (for example, with a chat-driven app builder like Koder.ai, where React frontends, Go backends, and PostgreSQL schemas can be generated and iterated fast), these guardrails matter even more: speed is a feature, but only if you also bake in telemetry (trace IDs, query fingerprinting, and safe logging) from the first iteration.
Make slow-query review someone’s job, not an afterthought:
With SLOs defining “what good looks like” and guardrails catching drift, performance stops being a recurring emergency and becomes a managed part of delivery.
A database-focused observability setup should help you answer two questions fast: “Is the database the bottleneck?” and “Which query (and which caller) caused it?” The best setups make that answer obvious without forcing engineers to grep through raw logs for an hour.
Required metrics (ideally broken down by instance, cluster, and role/replica):
Required log fields for slow query logs:
Trace tags to correlate requests to queries:
Dashboards and alerts you should expect:
Can it correlate a spike in endpoint latency to a specific query fingerprint and release version? How does it handle sampling so you keep rare, expensive queries? Does it deduplicate noisy statements (fingerprinting) and highlight regressions over time?
Look for built-in redaction (PII and literals), role-based access control, and clear retention limits for logs and traces. Make sure exporting data to your warehouse/SIEM doesn’t bypass those controls.
If your team is evaluating options, it can help to align requirements early—share a shortlist internally, then involve vendors. If you want a quick comparison or guidance, see /pricing or reach out via /contact.
Start by looking at tail latency (p95/p99) per endpoint, not just averages. Then correlate that with timeouts, retry rates, and database saturation signals (connection waits, lock waits, CPU/I/O).
If those move together, pivot into traces to find the slow span, and then into slow query logs to identify the exact query fingerprint behind it.
Averages hide outliers. A small fraction of very slow requests can make the product feel broken while the mean stays “normal.”
Track:
These reveal the long tail users actually experience.
Use them together as “where” + “what.”
The combination shortens time-to-root-cause dramatically.
It typically includes:
Prioritize fields that let you answer: Which service triggered it, when, and is this a recurring query pattern?
Pick thresholds based on user experience and your workload.
A practical approach:
Keep it actionable; don’t aim to log everything.
Use query fingerprinting (normalization) so the same query shape groups together even when IDs and timestamps differ.
Example: WHERE user_id = ? instead of WHERE user_id = 12345.
Then rank fingerprints by:
Don’t store raw sensitive literals.
Good practices:
A common cascade is:
Breaking the cycle often means reducing retries, restoring pool availability, and addressing the slow query fingerprint.
Alert on both symptoms and likely causes.
Symptoms (user impact):
Causes (investigation starters):
Start with low-risk mitigations, then fix the query.
Mitigate quickly:
Then fix:
This reduces incident-time data exposure risk.
Use multi-window/burn-rate patterns to reduce noise.
Validate with the same trace span and slow query fingerprint before/after.