Aug 21, 2025·8 min
Palantir Foundry vs Traditional BI: Beyond Dashboards
Learn how Palantir Foundry-style operational decision systems differ from traditional BI dashboards, reporting, and self-serve analytics—and when each fits best.
Learn how Palantir Foundry-style operational decision systems differ from traditional BI dashboards, reporting, and self-serve analytics—and when each fits best.
Most “BI vs Foundry” debates get stuck on features: which tool has better charts, faster queries, or nicer dashboards. That’s rarely the deciding factor. The real comparison is about what you’re trying to achieve.
A dashboard can tell you what happened (or what’s happening). An operational decision system is built to help people decide what to do next—and to make that decision repeatable, auditable, and connected to execution.
Insight is not the same as action. Knowing inventory is low is different from triggering a reorder, rerouting supply, updating a plan, and tracking whether the decision worked.
This article breaks down:
Although Palantir Foundry is a useful reference point, the concepts here apply broadly. Any platform that connects data, decision logic, and workflows will behave differently from tools designed primarily for dashboards and reporting.
If you lead operations, analytics, or a business function where decisions happen under time pressure (supply chain, manufacturing, customer ops, risk, field service), this comparison will help you align tooling with how work actually gets done—and where decisions break down today.
Traditional business intelligence (BI) tools are built to help organizations see what’s happening through dashboards and reporting. They’re excellent at turning data into shared metrics, trends, and summaries that leaders and teams can use to monitor performance.
Dashboards are designed for fast situational awareness: Are sales up or down? Are service levels within target? Which regions are underperforming?
Good dashboards make key metrics easy to scan, compare, and drill into. They give teams a common language (“this is the number we trust”) and help spot changes early—especially when paired with alerts or scheduled refreshes.
Reporting focuses on consistency and repeatability: month-end reports, weekly operational packs, compliance summaries, and executive scorecards.
The goal is stable definitions and predictable delivery: the same KPIs, calculated the same way, distributed on a cadence. This is where concepts like a semantic layer and certified metrics matter—everyone needs to interpret results the same way.
BI tools also support exploration when new questions arise: Why did conversion drop last week? Which products are driving returns? What changed after the pricing update?
Analysts can slice by segment, filter, build new views, and test hypotheses without waiting for engineering work. This low-friction access to insight is a major reason traditional business intelligence remains a staple.
BI shines when the output is understanding: quick time-to-dashboard, familiar UX, and wide adoption across business users.
The common limit is what happens next. A dashboard can highlight an issue, but it usually doesn’t execute the response: assign work, enforce decision logic, update operational systems, or track whether the action happened.
That “so what?” and “now what?” gap is a key reason teams look beyond dashboards and reporting when they need true analytics to action and decision workflows.
An operational decision system is built for the choices a business makes while work is happening—not after the fact. These decisions are frequent, time-sensitive, and repeatable: “What should we do next?” rather than “What happened last month?”
Traditional business intelligence is excellent for dashboards and reporting. An operational decision system goes further by packaging data + logic + workflow + accountability so analytics can reliably turn into action inside a real business process.
Operational decisions usually share a few traits:
Instead of producing a dashboard tile, the system produces actionable outputs that fit into work:
For example, rather than showing inventory trends, an operational decision system might generate reorder suggestions with thresholds, supplier constraints, and a human approval step. Instead of a customer service dashboard, it might create case prioritization with rules, risk scoring, and an audit trail. In field operations, it might propose schedule changes based on capacity and new constraints.
Success isn’t “more reports were viewed.” It’s improved outcomes in the business process: fewer stockouts, faster resolution times, reduced costs, higher SLA compliance, and clearer accountability.
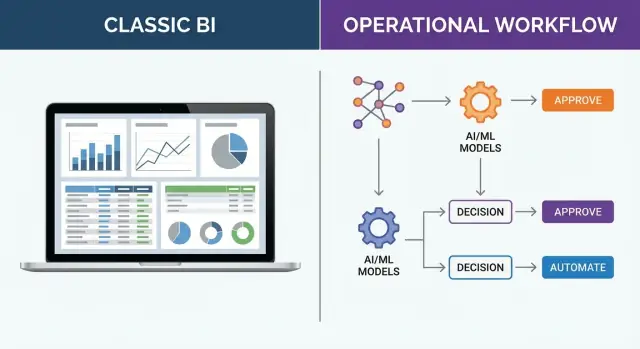
The most important difference in Palantir Foundry vs BI isn’t chart type or dashboard polish. It’s whether the system stops at insight (open loop) or continues through execution and learning (closed loop).
Traditional business intelligence is optimized for dashboards and reporting. A common flow looks like:
That last step matters: the “decision” happens in someone’s head, in a meeting, or across email threads. This works well for exploratory analysis, quarterly reviews, and questions where the next action is ambiguous.
Where delays happen in BI-only approaches is usually between “I see the issue” and “we did something about it”:
An operational decision system extends the pipeline beyond insight:
The difference is that “decide” and “execute” are part of the product, not a manual handoff. When decisions are repeatable (approve/deny, prioritize, allocate, route, schedule), encoding them as workflows plus decision logic reduces latency and inconsistency.
Closed loop means every decision is traceable to inputs, logic, and outcomes. You can measure: What did we choose? What happened next? Should the rule, model, or threshold change?
Over time, this creates continuous improvement: the system learns from real operations, not just what people remember to discuss later. That’s the practical bridge from analytics to action.
A traditional BI setup is usually a chain of components, each optimized for a specific step: a warehouse or lake for storage, ETL/ELT pipelines to move and shape data, a semantic layer to standardize metrics, and dashboards/reports to visualize outcomes.
It works well when the goal is consistent reporting and analysis, but the “action” often happens outside the system—via meetings, emails, and manual handoffs.
A Foundry-style approach tends to look more like a platform where data, transformation logic, and operational interfaces live closer together. Instead of treating analytics as the end of the pipeline, it treats analytics as one ingredient in a workflow that produces a decision, triggers a task, or updates an operational system.
In many BI environments, teams create datasets for a specific dashboard or question (“sales by region for Q3”). Over time, you can end up with many similar tables that drift apart.
With a “data product” mindset, the goal is a reusable, well-defined asset (inputs, owners, refresh behavior, quality checks, and expected consumers). That makes it easier to build multiple applications and workflows on the same trusted building blocks.
Traditional BI often leans on batch updates: nightly loads, scheduled model refreshes, and periodic reporting. Operational decisions frequently need fresher data—sometimes near-real-time—because the cost of acting late is high (missed shipments, stockouts, delayed interventions).
Dashboards are great for monitoring, but operational systems often need interfaces that capture and route work: forms, task queues, approvals, and lightweight apps. That’s the architectural shift from “see the numbers” to “complete the step.”
Dashboards can sometimes tolerate “mostly right” data: if two teams count customers differently, you can still create a chart and explain the mismatch in a meeting. Operational decision systems don’t get that luxury.
When a decision triggers work—approve a shipment, prioritize a maintenance crew, block a payment—definitions must be consistent across teams and systems, or automation quickly becomes unsafe.
Operational decisions depend on shared semantics: what is an “active customer,” a “fulfilled order,” or a “late delivery”? Without consistent definitions, one workflow step will interpret the same record differently than the next.
This is where a semantic layer and well-owned data products matter more than perfect visualizations.
Automation breaks when the system can’t reliably answer basic questions like “is this the same supplier?” Operational setups usually require:
If those foundations are missing, each integration becomes a one-off mapping that fails the moment a source system changes.
Multi-source data quality problems are common—duplicate IDs, missing timestamps, inconsistent units. A dashboard can filter or annotate; an operational workflow needs explicit handling: validation rules, fallbacks, and exception queues so humans can intervene without stopping the whole process.
Operational models need entities, states, constraints, and rules (e.g., “order → packed → shipped,” capacity limits, compliance constraints).
Designing pipelines around these concepts—and expecting change—helps avoid brittle integrations that collapse under new products, new regions, or new policies.
When you move from “viewing insights” to “triggering actions,” governance stops being a compliance checkbox and becomes an operational safety system.
Automation can multiply the impact of a mistake: a single bad join, stale table, or overly broad permission can propagate into hundreds of decisions in minutes.
In traditional BI, wrong data often leads to a wrong interpretation. In an operational decision system, wrong data can lead to a wrong outcome—inventory reallocated, orders rerouted, customers denied, prices changed.
That’s why governance must sit directly in the path from data → decision → action.
Dashboards typically focus on “who can see what.” Operational systems need finer separation:
This reduces the risk of “read access accidentally becoming write impact,” especially when workflows integrate with ticketing, ERP, or order management.
Good lineage isn’t just data provenance—it’s decision provenance. Teams should be able to trace a recommendation or action back through:
Equally important is auditability: recording why a recommendation was made (inputs, thresholds, model version, rule hits), not only what was recommended.
Operational decisions often require approvals, overrides, and controlled exceptions. Separating duties—builder vs approver, recommender vs executor—helps prevent silent failures and creates a clear, reviewable trail when the system encounters edge cases.
Dashboards answer “what happened?” Decision logic answers “what should we do next, and why?” In operational settings, that logic needs to be explicit, testable, and safe to change—because it can trigger approvals, reroutes, holds, or outreach.
Rule-based decisions work well when the policy is straightforward: “If inventory is below X, expedite,” or “If a case lacks required documents, request them before review.”
The benefit is predictability and auditability. The risk is brittleness: rules can conflict, or become outdated as the business changes.
Many real decisions aren’t binary—they’re allocation problems. Optimization helps when you have limited resources (staff hours, vehicles, budget) and competing goals (speed vs cost vs fairness).
Instead of a single threshold, you define constraints and priorities, then generate the “best available” plan. The key is to make the constraints readable to business owners, not just modelers.
Machine learning often fits as a scoring step: ranking leads, flagging risk, predicting delays. In operational workflows, ML should typically recommend, not silently decide—especially when outcomes affect customers or compliance.
People need to see the main drivers behind a recommendation: the inputs used, the reason codes, and what would change the outcome. This builds confidence and supports audits.
Operational logic must be monitored: input data shifts, performance changes, and unintended bias.
Use controlled releases (e.g., shadow mode, limited rollout) and versioning so you can compare results and roll back quickly.
Traditional BI is optimized for viewing: a dashboard, a report, a slice-and-dice view that helps someone understand what happened and why.
Operational decision systems are optimized for doing. The primary users are planners, dispatchers, case workers, and supervisors—people making many small, time-sensitive decisions where the “next step” can’t be a meeting or a ticket in another tool.
Dashboards excel at broad visibility and storytelling, but they often create friction at the moment action is needed:
That context switching is where delays, errors, and inconsistent decisions creep in.
Operational UX uses design patterns that guide a user from signal to resolution:
Instead of “here’s the chart,” the interface answers: What decision is needed, what information matters, and what action can I take right here?
In platforms like Palantir Foundry, this often means embedding decision steps directly into the same environment that assembles the underlying data and logic.
BI success is frequently measured by report usage. Operational systems should be judged like production tools:
Those metrics reveal whether the system is actually changing outcomes—not just generating insight.
Operational decision systems earn their keep when the goal isn’t “know what happened,” but “decide what to do next”—and do it consistently, quickly, and with traceability.
Dashboards can highlight stockouts or late shipments; an operational system helps resolve them.
It can recommend reallocations across DCs, prioritize orders based on SLAs and margins, and trigger replenishment requests—while recording why a decision was made (constraints, costs, and exceptions).
When a quality issue appears, teams need more than a chart of defect rates. A decision workflow can route incidents, suggest containment actions, identify affected lots, and coordinate line changeovers.
For maintenance scheduling, it can balance risk, technician availability, and production targets—then push the approved schedule into daily work instructions.
In clinical operations and claims, the bottleneck is often prioritization. Operational systems can triage cases using policies and signals (severity, waiting time, missing documentation), assign them to the right queue, and support capacity planning with “what-if” scenarios—without losing auditability.
During outages, decisions must be fast and coordinated. An operational system can merge SCADA/telemetry, weather, crew locations, and asset history to recommend dispatch plans, restoration sequencing, and customer communications—then track execution and updates as conditions change.
Fraud and credit teams live in workflows: review, request info, approve/decline, escalate. Operational decision systems can standardize those steps, apply consistent decision logic, and route items to the right reviewers.
In customer support, they can steer tickets based on intent, customer value, and required skills—improving outcomes, not just reporting on them.
Operational decision systems fail less when you implement them like a product, not a “data project.” The goal is to prove one decision loop end-to-end—data in, decision made, action taken, and outcomes measured—before expanding.
Pick one decision with clear business value and a real owner. Document the basics:
This keeps scope tight and makes success measurable.
Insights aren’t the finish line. Define “done” by specifying what action changes, and where it changes—e.g., a status update in a ticketing tool, an approval in ERP, a call list in CRM.
A good definition includes the target system, the exact field/state that changes, and how you’ll verify it happened.
Avoid trying to automate everything on day one. Start with an exceptions-first workflow: the system flags items that need attention, routes them to the right person, and tracks resolution.
Prioritize a few high-leverage integration points (ERP/CRM/ticketing) and make approval steps explicit. That reduces risk by preventing “shadow decisions” outside the system.
Operational tools change behavior. Include training, incentives, and new roles (such as workflow owners or data stewards) in the rollout plan so the process actually sticks.
One practical challenge with operational decision systems is that you often need lightweight apps—queues, approval screens, exception handling, and status updates—before you can prove value.
Platforms like Koder.ai can help teams prototype these workflow surfaces quickly using a chat-driven, vibe-coding approach: describe the decision flow, data entities, and roles, then generate an initial web app (often React) and backend (Go + PostgreSQL) that you can iterate on.
This doesn’t replace the need for sound data integration and governance, but it can shorten the “from decision definition to usable workflow” cycle—especially when you use planning mode to align stakeholders, and snapshots/rollback to test changes safely. If you later need to move the app into a different environment, source code export can reduce lock-in.
The simplest way to decide between Palantir Foundry vs BI tools is to start from the decision you’re trying to improve—not the features you’d like to buy.
Choose traditional business intelligence (dashboards and reporting) when your goal is visibility and learning:
If the main outcome is better understanding (not an immediate operational action), BI is usually the right fit.
An operational decision system is a better match when decisions are repeated and outcomes depend on consistent execution:
Here, the goal is analytics to action: turning data into decision workflows that reliably trigger the next step.
Many organizations keep BI for broad visibility and add decision workflows (plus governed data products and a semantic layer) where execution needs to be standardized.
Create a decision inventory, score each by business impact and feasibility, then pick one high-impact decision to pilot with clear success metrics.
Traditional BI is designed to monitor and explain performance through dashboards, reporting, and ad hoc analysis. An operational decision system is designed to produce and track actions by combining data + decision logic + workflow + auditability so decisions can be executed consistently inside real processes.
“Open loop” means the system ends at insight: ingest → model → visualize → human interprets, and execution happens in meetings, email, or other tools. “Closed loop” extends through decide → execute → learn, so actions are triggered, outcomes are recorded, and the decision logic can be improved based on real results.
Choose BI when the primary output is understanding, such as:
BI is usually enough when there isn’t a clear, repeatable “next action” that must be executed inside a workflow.
You need an operational decision system when decisions are:
In these cases, the value comes from reducing decision latency, inconsistency, and manual handoffs.
A dashboard typically outputs a metric or trend that requires someone to translate it into tasks elsewhere. A decision workflow outputs things like:
Success is measured by outcomes (e.g., fewer stockouts), not report views.
Operational systems need consistent semantics because automation can’t tolerate ambiguity. Common requirements include:
If these foundations are weak, workflows become brittle and unsafe to automate.
Because once insights trigger actions, mistakes scale fast. Practical controls include:
This turns governance into an operational safety system, not just a reporting checkbox.
Start with logic that’s explicit and testable:
Add monitoring and controlled releases (shadow mode, limited rollout, versioning) so you can measure impact and roll back safely.
Implement it like a product by proving one loop end-to-end:
Yes—many organizations use a hybrid:
A practical approach is to create a decision inventory, score candidates by impact and feasibility, then pilot one high-value loop before expanding.
This reduces scope risk while validating real operational value.