Jun 13, 2025·8 min
Palantir vs Enterprise Software: Integration, Analytics, Deployment
See how Palantir’s approach to data integration, operational analytics, and deployment differs from traditional enterprise software—and what it means for buyers.
See how Palantir’s approach to data integration, operational analytics, and deployment differs from traditional enterprise software—and what it means for buyers.
People often use “Palantir” as shorthand for a few related products and an overall way of building data-driven operations. To keep this comparison clear, it helps to name what’s actually being discussed—and what isn’t.
When someone says “Palantir” in an enterprise context, they typically mean one (or more) of these:
This post uses “Palantir-like” to describe the combination of (1) strong data integration, (2) a semantic/ontology layer that aligns teams on meaning, and (3) deployment patterns that can span cloud, on‑prem, and disconnected setups.
“Traditional enterprise software” isn’t one product—it’s the typical stack many organizations assemble over time, such as:
In this approach, integration, analytics, and operations are frequently handled by separate tools and teams, connected through projects and governance processes.
This is an approach comparison, not a vendor endorsement. Many organizations succeed with conventional stacks; others benefit from a more unified platform model.
The practical question is: what trade-offs are you making in speed, control, and how directly analytics connects to day-to-day work?
To keep the rest of the article grounded, we’ll focus on three areas:
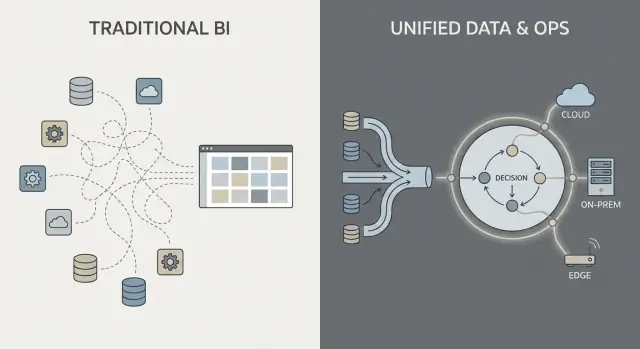
Most “traditional enterprise software” data work follows a familiar chain: pull data from systems (ERP, CRM, logs), transform it, load it into a warehouse or lake, and then build BI dashboards plus a few downstream apps.
That pattern can work well, but it often turns integration into a series of fragile handoffs: one team owns extraction scripts, another owns warehouse models, a third owns dashboard definitions, and business teams maintain spreadsheets that quietly redefine “the real number.”
With ETL/ELT, changes tend to ripple. A new field in the source system can break a pipeline. A “quick fix” creates a second pipeline. Soon you have duplicated metrics (“revenue” in three places), and it’s unclear who is responsible when numbers don’t match.
Batch processing is common here: data lands nightly, dashboards update in the morning. Near-real-time is possible, but it often becomes a separate streaming stack with its own tooling and owners.
A Palantir-style approach aims to unify sources and apply consistent semantics (definitions, relationships, and rules) earlier, then expose the same curated data to analytics and operational workflows.
In plain terms: instead of each dashboard or app “figuring out” what a customer, asset, case, or shipment means, that meaning is defined once and reused. This can reduce duplicated logic and make ownership clearer—because when a definition changes, you know where it lives and who approves it.
Integration usually fails on responsibilities, not connectors:
The key question isn’t just “Can we connect to system X?” It’s “Who owns the pipeline, the metric definitions, and the business meaning over time?”
Traditional enterprise software often treats “meaning” as an afterthought: data is stored in many app-specific schemas, metric definitions live inside individual dashboards, and teams quietly maintain their own versions of “what an order is” or “when a case is considered resolved.” The result is familiar—different numbers in different places, slow reconciliation meetings, and unclear ownership when something looks off.
In a Palantir-like approach, the semantic layer is not just a reporting convenience. An ontology acts as a shared business model that defines:
This becomes the “center of gravity” for analytics and operations: multiple data sources can still exist, but they map into a common set of business objects with consistent definitions.
A shared model reduces mismatched numbers because teams aren’t reinventing definitions in every report or app. It also improves accountability: if “On-time delivery” is defined against Shipment events in the ontology, it’s clearer who owns the underlying data and business logic.
Done well, an ontology doesn’t just make dashboards cleaner—it makes day-to-day decisions faster and less argumentative.
BI dashboards and traditional reporting are primarily about hindsight and monitoring. They answer questions like “What happened last week?” or “Are we on track against KPIs?” A sales dashboard, a finance close report, or an executive scorecard is valuable—but it often stops at visibility.
Operational analytics is different: it’s analytics embedded in day-to-day decisions and execution. Instead of a separate “analytics destination,” analysis shows up inside the workflow where work is performed, and it drives a specific next step.
BI/reporting typically focuses on:
That’s excellent for governance, performance management, and accountability.
Operational analytics focuses on:
Concrete examples look less like “a chart” and more like a work queue with context:
The most important change is that analysis is tied to a specific workflow step. A BI dashboard might show “late deliveries are up.” Operational analytics turns that into “here are the 37 shipments at risk today, the likely causes, and the recommended interventions,” with the ability to execute or assign the next action immediately.
Traditional enterprise analytics often ends with a dashboard view: someone spots an issue, exports to CSV, emails a report, and a separate team “does something” later. A Palantir-like approach is designed to shorten that gap by embedding analytics directly into the workflow where decisions are made.
Workflow-centered systems typically generate recommendations (e.g., “prioritize these 12 shipments,” “flag these 3 vendors,” “schedule maintenance within 72 hours”) but still require explicit approvals. That approval step matters because it creates:
This is especially useful in regulated or high-stakes operations where “the model said so” is not an acceptable justification.
Instead of treating analytics as a separate destination, the interface can route insights into tasks: assign to a queue, request sign-off, trigger a notification, open a case, or create a work order. The important shift is that outcomes are tracked inside the same system—so you can measure whether actions actually reduced risk, cost, or delays.
Workflow-centered design usually separates experiences by role:
The common success factor is aligning the product with decision rights and operating procedures: who is allowed to act, what approvals are required, and what “done” means operationally.
Governance is where many analytics programs succeed or stall. It’s not just “security settings”—it’s the practical set of rules and evidence that lets people trust the numbers, share them safely, and use them to make real decisions.
Most enterprises need the same core controls, regardless of vendor:
These aren’t bureaucracy for its own sake. They’re how you prevent the “two versions of the truth” problem and reduce risk when analytics moves closer to operations.
Traditional BI implementations often put security mainly at the report layer: users can view certain dashboards, and administrators manage permissions there. That can work when analytics is mostly descriptive.
A Palantir-like approach pushes security and governance through the entire pipeline: from raw data ingestion, to the semantic layer (objects, relationships, definitions), to models, and even to the actions triggered from insights. The goal is that an operational decision (like dispatching a crew, releasing inventory, or prioritizing cases) inherits the same controls as the data behind it.
Two principles matter for safety and accountability:
For example, an analyst might propose a metric definition, a data steward approves it, and operations uses it—with a clear audit trail.
Good governance isn’t just for compliance teams. When business users can click into lineage, see definitions, and rely on consistent permissions, they stop arguing about the spreadsheet and start acting on the insight. That confidence is what turns analytics from “interesting reports” into operational behavior.
Where enterprise software runs is no longer an IT detail—it shapes what you can do with data, how quickly you can change, and what risks you can accept. Buyers usually evaluate four deployment patterns.
Public cloud (AWS/Azure/GCP) optimizes for speed: provisioning is fast, managed services reduce infrastructure work, and scaling is straightforward. The main buyer questions are data residency (which region, which backups, which support access), integration to on-prem systems, and whether your security model can tolerate cloud network connectivity.
A private cloud (single-tenant or customer-managed Kubernetes/VMs) is often chosen when you need cloud-like automation but tighter control over network boundaries and audit requirements. It can reduce some compliance friction, but you still need strong operational discipline around patching, monitoring, and access reviews.
On-prem deployments remain common in manufacturing, energy, and highly regulated sectors where core systems and data cannot leave the facility. The trade-off is operational overhead: hardware lifecycle, capacity planning, and more work to keep environments consistent across dev/test/prod. If your organization struggles to run platforms reliably, on-prem can slow time-to-value.
Disconnected (air-gapped) environments are a special case: defense, critical infrastructure, or sites with limited connectivity. Here, the deployment model must support strict update controls—signed artifacts, controlled promotion of releases, and repeatable installation in isolated networks.
Network constraints also affect data movement: instead of continuous sync, you may rely on staged transfers and “export/import” workflows.
In practice, it’s a triangle: flexibility (cloud), control (on-prem/air-gapped), and speed of change (automation + updates). The right choice depends on residency rules, network realities, and how much platform operations your team is willing to own.
“Apollo-like delivery” is basically continuous delivery for high-stakes environments: you can ship improvements frequently (weekly, daily, even multiple times per day) while keeping operations steady.
The goal isn’t “move fast and break things.” It’s “move often and don’t break anything.”
Instead of bundling changes into a big quarterly release, teams deliver small, reversible updates. Each update is easier to test, easier to explain, and easier to roll back if something goes wrong.
For operational analytics, that matters because your “software” is not just a UI—it’s data pipelines, business logic, and the workflows people rely on. A safer update process becomes part of day-to-day operations.
Traditional enterprise software upgrades often look like projects: long planning windows, downtime coordination, compatibility worries, retraining, and a hard cutover date. Even when vendors offer patches, many organizations delay updates because the risk and effort are unpredictable.
Apollo-like tooling aims to make upgrading routine rather than exceptional—more like maintaining infrastructure than executing a major migration.
Modern deployment tooling can let teams develop and test in isolated environments, then “promote” the same build through stages (dev → test → staging → production) with consistent controls. That separation helps reduce last-minute surprises caused by differences between environments.
Time-to-value is less about how quickly you can “install” something and more about how fast teams can agree on definitions, connect messy data, and turn insights into day-to-day decisions.
Traditional enterprise software often emphasizes configuration: you adopt a predefined data model and workflows, then map your business into them.
Palantir-like platforms tend to mix three modes:
The promise is flexibility—but it also means you need clarity on what you’re building versus what you’re standardizing.
One practical option during early discovery is to prototype workflow apps quickly—before committing to a large platform rollout. For example, teams sometimes use Koder.ai (a vibe-coding platform) to turn a workflow description into a working web app via chat, then iterate with stakeholders using planning mode, snapshots, and rollback. Because Koder.ai supports source code export and typical production stacks (React on the web; Go + PostgreSQL on the backend; Flutter for mobile), it can be a low-friction way to validate “insight → task → audit trail” UX and integration requirements during a proof-of-value.
Most effort usually goes into four areas:
Watch for unclear ownership (no accountable data/product owner), too many bespoke definitions (each team invents its own metrics), and no path from pilot to scale (a demo that can’t be operationalized, supported, or governed).
A good pilot is intentionally narrow: pick one workflow, define specific users, and commit to a measurable outcome (e.g., reduce turnaround time by 15%, cut exception backlog by 30%). Design the pilot so the same data, semantics, and controls can extend to the next use case—rather than starting over.
Cost conversations can get confusing because a “platform” bundles capabilities that are often bought as separate tools. The key is to map pricing to the outcomes you need (integration + modeling + governance + operational apps), not just to a line item called “software.”
Most platform deals are shaped by a handful of variables:
A point-solution approach can look cheaper at first, but the total cost tends to spread across:
Platforms often reduce tool sprawl, but you’re trading it for a larger, more strategic contract.
With a platform, procurement should treat it like shared infrastructure: define enterprise scope, data domains, security requirements, and delivery milestones. Ask for clear separation between license, cloud/infrastructure, and services, so you can compare apples-to-apples.
If you want a quick way to structure assumptions, see /pricing.
Palantir-like platforms tend to shine when the problem is operational (people need to make decisions and take actions across systems), not just analytical (people need a report). The trade-off is that you’re adopting a more “platform” style approach—powerful, but it asks more of your organization than a simple BI rollout.
A Palantir-like approach is usually a strong fit when work spans multiple systems and teams and you can’t afford brittle handoffs.
Common examples include cross-system operations such as supply chain coordination, fraud and risk operations, mission planning, case management, or fleet and maintenance workflows—where the same data must be interpreted consistently by different roles.
It’s also a strong fit when permissions are complex (row/column-level access, multi-tenant data, need-to-know rules) and when you need a clear audit trail of how data was used.
Finally, it fits well in regulated or constrained environments: on‑prem requirements, air‑gapped/disconnected deployments, or strict security accreditation where the deployment model is a first-class requirement, not an afterthought.
If the goal is mainly straightforward reporting—weekly KPIs, a few dashboards, basic finance rollups—traditional BI on top of a well-managed warehouse can be faster and cheaper.
It can also be overkill for small datasets, stable schemas, or single-department analytics where one team controls the sources and definitions, and the main “action” happens outside the tool.
Ask three practical questions:
The best outcomes come from treating this as “fit to problem,” not “one tool replaces everything.” Many organizations keep existing BI for broad reporting while using a Palantir-like approach for the highest-stakes operational domains.
Buying a “Palantir-like” platform versus traditional enterprise software is less about feature checkboxes and more about where the real work will land: integration, shared meaning (semantics), and day‑to‑day operational use. Use the checklist below to force clarity early, before you get locked into a long implementation or a narrow point tool.
Ask each vendor to be specific about who does what, how it stays consistent, and how it’s used in real operations.
Include stakeholders who will live with the tradeoffs:
Run a time-boxed proof-of-value centered on one high-stakes operational workflow (not a generic dashboard). Define success criteria in advance: time-to-decision, error reduction, auditability, and ownership of ongoing data work.
If you want more guidance on evaluation patterns, see /blog. For help scoping a proof-of-value or vendor shortlisting, reach out at /contact.
In this post, “Palantir” is shorthand for a platform-style approach commonly associated with Foundry (commercial data/operations platform), Gotham (public sector/defense roots), and Apollo (deployment/delivery across environments).
“Traditional enterprise software” refers to the more common assembled stack: ERP/CRM + warehouse/lake + BI + ETL/ELT/iPaaS and integration middleware, often owned by separate teams and connected via projects and governance processes.
A semantic layer is where you define business meaning once (e.g., what “Order,” “Customer,” or “On-time delivery” means) and then reuse it across analytics and workflows.
An ontology goes further by modeling:
The practical benefit is fewer conflicting definitions across dashboards, apps, and teams—and clearer ownership when definitions change.
Traditional ETL/ELT often becomes a relay race: source extracts → transformations → warehouse models → dashboards, with separate owners at each step.
Common failure modes are:
A Palantir-like pattern tries to standardize meaning earlier and then reuse the curated objects everywhere, reducing duplicated logic and making change control more explicit.
BI dashboards are mainly observe and explain: monitoring KPIs, scheduled refreshes, and retrospective analysis.
Operational analytics is decide and do:
If the output is “a chart,” it’s usually BI. If the output is “here’s what to do next, and do it here,” it’s operational analytics.
A workflow-centered system shortens the gap between insight and execution by embedding analysis into the place work happens.
In practice, it replaces “export to CSV and email” with:
The goal is not prettier reporting—it’s faster, auditable decisions.
“Human-in-the-loop” means the system can recommend actions, but people explicitly approve or override them.
This matters because it creates:
It’s especially important in regulated or high-stakes operations where blind automation is unacceptable.
Governance isn’t just logins; it’s the operational rules and evidence that make data safe and trustworthy.
At minimum, enterprises typically need:
When governance is strong, teams spend less time reconciling numbers and more time acting on them.
The deployment choice constrains speed, control, and operating overhead:
Apollo-like delivery is continuous delivery designed for constrained, high-stakes environments: frequent, small, reversible updates with strong controls.
Compared to traditional upgrade projects, it emphasizes:
This matters because operational analytics depends on reliable pipelines and business logic, not just reports.
A scalable proof-of-value is narrow and operational.
A practical structure:
Pick based on residency rules, network realities, and how much platform operations you can support.
Avoid “generic dashboards” as the pilot goal if the real aim is operational impact.