Sep 12, 2025·8 min
Production observability starter pack for day-one monitoring
Production observability starter pack for day one: the minimum logs, metrics, and traces to add, plus a simple triage flow for “it’s slow” reports.
Production observability starter pack for day one: the minimum logs, metrics, and traces to add, plus a simple triage flow for “it’s slow” reports.
The first thing that breaks is rarely the whole app. It’s usually one step that suddenly gets busy, one query that was fine in tests, or one dependency that starts timing out. Real users add real variety: slower phones, flaky networks, weird inputs, and traffic spikes at inconvenient times.
When someone says “it’s slow,” they can mean very different things. The page might take too long to load, interactions might lag, one API call might be timing out, background jobs might be piling up, or a third-party service might be dragging everything down.
That’s why you need signals before you need dashboards. On day one, you don’t need perfect charts for every endpoint. You need enough logs, metrics, and traces to answer one question quickly: where is the time going?
There’s also a real risk in over-instrumenting early. Too many events create noise, cost money, and can even slow the app down. Worse, teams stop trusting telemetry because it feels messy and inconsistent.
A realistic day-one goal is simple: when you get an “it’s slow” report, you can find the slow step in under 15 minutes. You should be able to tell whether the bottleneck is in client rendering, the API handler and its dependencies, the database or cache, or a background worker or external service.
Example: a new checkout flow feels slow. Even without a mountain of tooling, you still want to be able to say, “95% of the time is in payment provider calls,” or “the cart query is scanning too many rows.” If you build apps fast with tools like Koder.ai, that day-one baseline matters even more, because shipping speed only helps if you can debug fast too.
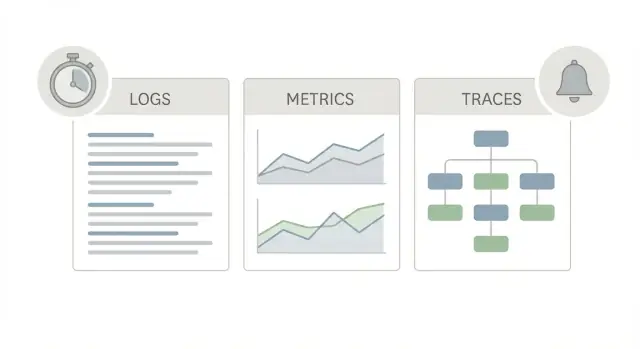
A good production observability starter pack uses three different “views” of the same app, because each one answers a different question.
Logs are the story. They tell you what happened for one request, one user, or one background job. A log line can say “payment failed for order 123” or “DB timeout after 2s,” plus details like request ID, user ID, and the error message. When someone reports a weird one-off issue, logs are often the fastest way to confirm it happened and who it affected.
Metrics are the scoreboard. They are numbers you can trend and alert on: request rate, error rate, latency percentiles, CPU, queue depth. Metrics tell you whether something is rare or widespread, and whether it’s getting worse. If latency jumped for everyone at 10:05, metrics will show it.
Traces are the map. A trace follows a single request as it moves through your system (web -> API -> database -> third-party). It shows where time is spent, step by step. That matters because “it’s slow” is almost never one big mystery. It’s usually one slow hop.
During an incident, a practical flow looks like this:
A simple rule: if you can’t point to one bottleneck after a few minutes, you don’t need more alerts. You need better traces, and consistent IDs that connect traces to logs.
Most “we can’t find it” incidents aren’t caused by missing data. They happen because the same thing is recorded differently across services. A few shared conventions on day one make logs, metrics, and traces line up when you need answers fast.
Start by choosing one service name per deployable unit and keep it stable. If “checkout-api” becomes “checkout” in half your dashboards, you lose history and break alerts. Do the same for environment labels. Pick a small set like prod and staging, and use them everywhere.
Next, make every request easy to follow. Generate a request ID at the edge (API gateway, web server, or first handler) and pass it through HTTP calls, message queues, and background jobs. If a support ticket says “it was slow at 10:42,” a single ID lets you pull the exact logs and trace without guessing.
A convention set that works well on day one:
Agree on time units early. Pick milliseconds for API latency and seconds for longer jobs, and stick with it. Mixed units create charts that look fine but tell the wrong story.
A concrete example: if every API logs duration_ms, route, status, and request_id, then a report like “checkout is slow for tenant 418” becomes a quick filter, not a debate about where to start.
If you only do one thing in your production observability starter pack, make logs easy to search. That starts with structured logs (usually JSON) and the same fields across every service. Plain text logs are fine for local dev, but they turn into noise once you have real traffic, retries, and multiple instances.
A good rule: log what you will actually use during an incident. Most teams need to answer: What request was this? Who did it? Where did it fail? What did it touch? If a log line doesn’t help with one of those, it probably shouldn’t exist.
For day one, keep a small, consistent set of fields so you can filter and join events across services:
When an error happens, log it once, with context. Include an error type (or code), a short message, a stack trace for server errors, and the upstream dependency involved (for example: postgres, payment provider, cache). Avoid repeating the same stack trace on every retry. Instead, attach the request_id so you can follow the chain.
Example: a user reports they can’t save settings. One search for request_id shows a 500 on PATCH /settings, then a downstream timeout to Postgres with duration_ms. You didn’t need full payloads, only the route, user/session, and the dependency name.
Privacy is part of logging, not a later task. Don’t log passwords, tokens, auth headers, full request bodies, or sensitive PII. If you need to identify a user, log a stable ID (or a hashed value) instead of emails or phone numbers.
If you build apps on Koder.ai (React, Go, Flutter), it’s worth baking these fields into every generated service from the start so you don’t end up “fixing logging” during your first incident.
A good production observability starter pack starts with a small set of metrics that answer one question fast: is the system healthy right now, and if not, where is it hurting?
Most production issues show up as one of four “golden signals”: latency (responses are slow), traffic (load changed), errors (things fail), and saturation (a shared resource is maxed out). If you can see these four signals per major part of your app, you can triage most incidents without guessing.
Latency should be percentiles, not averages. Track p50, p95, and p99 so you can see when a small group of users is having a bad time. For traffic, start with requests per second (or jobs per minute for workers). For errors, split 4xx vs 5xx: rising 4xx often means client behavior or validation changes; rising 5xx points to your app or its dependencies. Saturation is the “we are running out of something” signal (CPU, memory, DB connections, queue backlog).
A minimum set that covers most apps:
A concrete example: if users report “it’s slow” and API p95 latency spikes while traffic stays flat, check saturation next. If DB pool usage is pinned near max and timeouts rise, you’ve found a likely bottleneck. If the DB looks fine but queue depth grows fast, background work might be starving shared resources.
If you build apps on Koder.ai, treat this checklist as part of your day-one definition of done. It’s easier to add these metrics while the app is small than during the first real incident.
If a user says “it’s slow,” logs often tell you what happened, and metrics tell you how often it happens. Traces tell you where time went inside one request. That single timeline turns a vague complaint into a clear fix.
Start on the server side. Instrument inbound requests at the edge of your app (the first handler that receives the request) so every request can produce one trace. Client-side tracing can wait.
A good day-one trace has spans that map to the parts that usually cause slowness:
To make traces searchable and comparable, capture a few key attributes and keep them consistent across services.
For the inbound request span, record route (use a template like /orders/:id, not the full URL), HTTP method, status code, and latency. For database spans, record the DB system (PostgreSQL, MySQL), operation type (select, update), and the table name if it’s easy to add. For external calls, record the dependency name (payments, email, maps), target host, and status.
Sampling matters on day one, otherwise costs and noise grow fast. Use a simple head-based rule: trace 100% of errors and slow requests (if your SDK supports it), and sample a small percentage of normal traffic (like 1-10%). Start higher in low traffic, then reduce as usage grows.
What “good” looks like: one trace where you can read the story top to bottom. Example: GET /checkout took 2.4s, DB spent 120ms, cache 10ms, and an external payment call took 2.1s with a retry. Now you know the problem is the dependency, not your code. This is the core of a production observability starter pack.
When someone says “it’s slow,” the fastest win is to turn that vague feeling into a few concrete questions. This production observability starter pack triage flow works even if your app is brand new.
Start by narrowing the problem, then follow the evidence in order. Don’t jump straight to the database.
After you’ve stabilized things, do one small improvement: write down what happened and add one missing signal. For example, if you couldn’t tell whether the slowdown was only in one region, add a region tag to latency metrics. If you saw a long database span with no clue which query, add query labels carefully, or a “query name” field.
A quick example: if checkout p95 jumps from 400 ms to 3 s and traces show a 2.4 s span in a payment call, you can stop debating the app code and focus on the provider, retries, and timeouts.
When someone says “it’s slow,” you can waste an hour just figuring out what they mean. A production observability starter pack is only useful if it helps you narrow the problem fast.
Start with three clarifying questions:
Then look at a few numbers that usually tell you where to go next. Don’t hunt for the perfect dashboard. You just want “worse than normal” signals.
If p95 is up but errors are flat, open one trace for the slowest route in the last 15 minutes. A single trace often shows whether time is spent in the database, an external API call, or waiting on locks.
Then do one log search. If you have a specific user report, search by their request_id (or correlation ID) and read the timeline. If you don’t, search for the most common error message in the same time window and see if it lines up with the slowdown.
Finally, decide whether to mitigate now or dig deeper. If users are blocked and saturation is high, a quick mitigation (scale up, roll back, or disable a non-essential feature flag) can buy time. If impact is small and the system is stable, keep investigating with traces and slow query logs.
A few hours after a release, support tickets start coming in: “Checkout takes 20 to 30 seconds.” Nobody can reproduce it on their laptop, so guessing starts. This is where a production observability starter pack pays off.
First, go to metrics and confirm the symptom. The p95 latency chart for HTTP requests shows a clear spike, but only for POST /checkout. Other routes look normal, and error rate is flat. That narrows it from “the whole site is slow” to “one endpoint got slower after release.”
Next, open a trace for a slow POST /checkout request. The trace waterfall makes the culprit obvious. Two common outcomes:
Now validate with logs, using the same request ID from the trace (or the trace ID if you store it in logs). In the logs for that request, you see repeated warnings like “payment timeout reached” or “context deadline exceeded,” plus retries that were added in the new release. If it’s the database path, logs might show lock wait messages or a slow query statement logged over a threshold.
With all three signals aligned, the fix becomes straightforward:
The key is that you didn’t hunt. Metrics pointed to the endpoint, traces pointed to the slow step, and logs confirmed the failure mode with the exact request in hand.
Most incident time is lost on avoidable gaps: the data is there, but it’s noisy, risky, or missing the one detail you need to connect symptoms to a cause. A production observability starter pack only helps if it stays usable under stress.
One common trap is logging too much, especially raw request bodies. It sounds helpful until you’re paying for huge storage, searching becomes slow, and you accidentally capture passwords, tokens, or personal data. Prefer structured fields (route, status code, latency, request_id) and log only small, explicitly allowed slices of input.
Another time sink is metrics that look detailed but are impossible to aggregate. High-cardinality labels like full user IDs, emails, or unique order numbers can explode your metric series count and make dashboards unreliable. Use coarse labels instead (route name, HTTP method, status class, dependency name), and keep anything user-specific in logs where it belongs.
Mistakes that repeatedly block fast diagnosis:
A small practical example: if checkout p95 jumps from 800ms to 4s, you want to answer two questions in minutes: did it start right after a deploy, and is the time spent in your app or in a dependency (database, payment provider, cache)? With percentiles, a release tag, and traces with route plus dependency names, you can get there quickly. Without them, you burn the incident window arguing about guesses.
The real win is consistency. A production observability starter pack only helps if every new service ships with the same basics, named the same way, and easy to find when something breaks.
Turn your day-one choices into a short template your team reuses. Keep it small, but specific.
Create one “home” view that anyone can open during an incident. One screen should show requests per minute, error rate, p95 latency, and your main saturation metric, with a filter for environment and version.
Keep alerting minimal at first. Two alerts cover a lot: an error rate spike on a key route, and a p95 latency spike on the same route. If you add more, make sure each one has a clear action.
Finally, set a recurring monthly review. Remove noisy alerts, tighten naming, and add one missing signal that would have saved time in the last incident.
To bake this into your build process, add an “observability gate” to your release checklist: no deploy without request IDs, version tags, the home view, and the two baseline alerts. If you ship with Koder.ai, you can define these day-one signals in planning mode before deployment, then iterate safely using snapshots and rollback when you need to adjust quickly.
Start with the first place users enter your system: the web server, API gateway, or your first handler.
request_id and pass it through every internal call.route, method, status, and duration_ms for every request.That alone usually gets you to a specific endpoint and a specific time window fast.
Aim for this default: you can identify the slow step in under 15 minutes.
You don’t need perfect dashboards on day one. You need enough signal to answer:
Use them together, because each answers a different question:
During an incident: confirm impact with metrics, find the bottleneck with traces, explain it with logs.
Pick a small set of conventions and apply them everywhere:
Default to structured logs (often JSON) with the same keys everywhere.
Minimum fields that pay off immediately:
Start with the four “golden signals” per major component:
Then add a tiny component checklist:
Instrument server-side first so every inbound request can create a trace.
A useful day-one trace includes spans for:
Make spans searchable with consistent attributes like (template form), , and a clear dependency name (for example , , ).
A simple, safe default is:
Start higher when traffic is low, then reduce as volume grows.
The goal is to keep traces useful without exploding cost or noise, and still have enough examples of the slow path to diagnose it.
Use a repeatable flow that follows evidence:
These mistakes burn time (and sometimes money):
service_name, environment (like prod/staging), and versionrequest_id generated at the edge and propagated across calls and jobsroute, method, status_code, and tenant_id (if multi-tenant)duration_ms)The goal is that one filter works across services instead of starting over each time.
timestamp, level, service_name, environment, versionrequest_id (and trace_id if available)route, method, status_code, duration_msuser_id or session_id (a stable ID, not an email)Log errors once with context (error type/code + message + dependency name). Avoid repeating the same stack trace on every retry.
routestatus_codepaymentspostgrescacheWrite down the one missing signal that would have made this faster, and add it next.
Keep it simple: stable IDs, percentiles, clear dependency names, and version tags everywhere.