

Siemens and the Cloud: Automation, Software & Digital Twins
See how Siemens combines automation, industrial software, and digital twins to connect machines and factories with cloud analytics and operations.
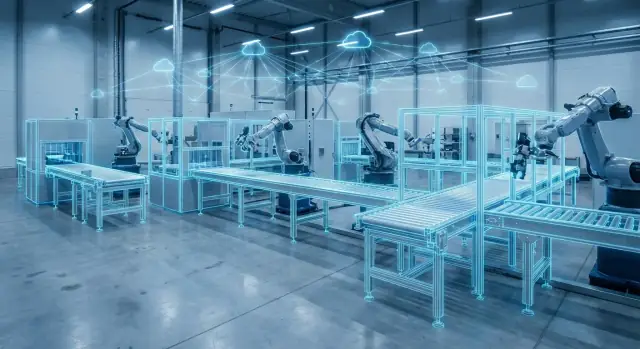
What “connecting the physical economy to the cloud” means
“Connecting the physical economy to the cloud” is about linking real-world industrial work—machines running on a line, pumps moving water, robots assembling products, trucks loading goods—to software that can analyze, coordinate, and improve that work.
Here, “physical economy” simply means the parts of the economy that produce and move tangible things: manufacturing, energy production and distribution, building systems, and logistics. These environments generate constant signals (speed, temperature, vibration, quality checks, energy use), but the value shows up when those signals can be turned into decisions.
The goal: from signals to outcomes
The cloud adds scalable computing and shared data access. When factory and plant data reaches cloud applications, teams can spot patterns across multiple lines or sites, compare performance, plan maintenance, improve schedules, and trace quality issues faster.
The goal isn’t “sending everything to the cloud.” It’s getting the right data to the right place so actions in the real world improve.
Siemens’ three pillars (in plain terms)
This connection is often described through three building blocks:
- Automation: the hardware and control layer that runs the process (sensors, PLCs, drives). It’s the primary source of reliable operational data.
- Industrial software: tools that plan, execute, and optimize work across engineering and production (for example, PLM and MES).
- Digital twins: digital representations of products, production systems, or performance that help predict and test changes before making them on the shop floor.
What to expect in this guide
Next, we’ll walk through the concepts with practical examples—how data moves edge-to-cloud, how insights get turned into shop-floor actions, and an adoption path from pilot to scale. If you want a preview of the implementation steps, jump ahead to /blog/a-practical-adoption-roadmap-pilot-to-scale.
A quick tour of Siemens’ approach (portfolio at a glance)
Siemens’ “connect physical to cloud” story is easiest to understand as three layers that work together: automation that generates and controls real-world data, industrial software that structures that data across the lifecycle, and data platforms that move it securely to where analytics and applications can use it.
1) Automation: where data is born (and where actions happen)
On the shop floor, Siemens’ industrial automation domain includes controllers (PLCs), drives, HMI/operator panels, and industrial networks—the systems that read sensors, run control logic, and keep machines in spec.
This layer is outcome-critical because it’s where cloud insights eventually must translate back into setpoints, work instructions, alarms, and maintenance actions.
2) Industrial software: connecting engineering to production
Siemens industrial software spans tools used before and during production—think engineering, simulation, PLM, and MES working as one thread. In practical terms, this is the “glue” that helps teams reuse designs, standardize processes, manage change, and keep the as-designed, as-planned, and as-built views aligned.
The payoff is usually straightforward and measurable: faster engineering changes, less rework, higher uptime, more consistent quality, and lower scrap/waste because decisions are based on the same structured context.
3) Data platforms: getting factory signals to cloud applications
Between machines and cloud applications sit connectivity and data layers (often grouped under industrial IoT and edge-to-cloud integration). The goal is to move the right data—securely and with context—into cloud or hybrid environments where teams can run dashboards, analytics, and cross-site comparisons.
Siemens Xcelerator (high-level)
You’ll often see these pieces framed under Siemens Xcelerator—an umbrella for Siemens’ portfolio plus an ecosystem of partners and integrations. It’s best thought of as a way to package and connect capabilities rather than a single product.
A simple mental model (diagram in words)
Shop floor (sensors/machines) → automation/control (PLC/HMI/drives) → edge (collect/normalize) → cloud (store/analyze) → apps (maintenance, quality, energy) → actions back on the shop floor (adjust, schedule, alert).
That loop—from real equipment to cloud insight and back to real action—is the throughline for smart manufacturing initiatives.
OT meets IT: why the connection is hard (and worth it)
Factories run on two very different kinds of technology that grew up separately.
OT vs IT (plain language)
Operational Technology (OT) is what makes physical processes run: sensors, drives, PLCs, CNCs, SCADA/HMI screens, and safety systems. OT cares about milliseconds, uptime, and predictable behavior.
Information Technology (IT) is what manages information: networks, servers, databases, identity management, ERP, analytics, and cloud apps. IT cares about standardization, scalability, and protecting data across many users and locations.
Historically, factories kept OT and IT apart because isolation improved reliability and safety. Many production networks were built to “just run” for years, with limited change, limited internet access, and strict control over who touches what.
Why integration is painful
Connecting the shop floor to enterprise and cloud systems sounds simple until you hit common friction points:
- Protocols and interfaces: equipment may speak OPC UA, PROFINET, Modbus, proprietary drivers, or older serial standards.
- Naming and context: Tag names like “T_001” mean nothing outside the line unless you map them to a consistent structure (asset, location, unit, product).
- Time-series vs business data: OT produces high-frequency signals (temperatures, states, alarms). IT systems expect transactions (orders, batches, work centers). Joining these datasets is hard without shared identifiers and time alignment.
- Security differences: OT prioritizes availability; IT prioritizes confidentiality and patching. Policies can clash.
Connectivity isn’t enough: data models matter
Even if every device is connected, value is limited without a standard data model—a shared way to describe assets, events, and KPIs. Standardized models reduce custom mapping, make analytics reusable, and help multiple plants compare performance.
The closed loop (why it’s worth it)
The goal is a practical cycle: data → insight → change. Machine data is collected, analyzed (often with production context), and then turned into actions—updating schedules, adjusting setpoints, improving quality checks, or changing maintenance plans—so cloud insights actually improve shop-floor operations.
Automation as the data engine: from sensors to control systems
Factory data doesn’t start in the cloud—it starts on the machine. In a Siemens-style setup, the “automation layer” is where physical signals become reliable, time-stamped information that other systems can safely use.
What industrial automation typically includes
At a practical level, automation is a stack of components working together:
- Sensors and actuators that measure (temperature, pressure, vibration, position) and act (valves, motors, relays).
- PLCs (programmable logic controllers) that run the control logic—what should happen, when, and under which conditions.
- Drives and motion control to regulate motor speed/torque and coordinate precise movement (conveyors, robots, packaging lines).
- HMI/SCADA to visualize status, trends, alarms, and operator actions.
- Safety systems that enforce safe states (e-stop, guard doors, safe speed), often with separate certified logic and diagnostics.
Engineering environments: where “truth” is defined
Before any data is trusted, someone has to define what each signal means. Engineering environments are used to:
- Configure PLC programs and interlocks
- Set up industrial networks and device addressing
- Define alarm thresholds, priorities, and acknowledgment rules
- Commission safety logic and diagnostics
This is important because it standardizes data at the source—tag names, units, scaling, and states—so higher-level software isn’t guessing.
From real-time signals to actionable work
A concrete flow might look like this:
A bearing temperature sensor rises above a warning threshold → the PLC detects it and sets a status bit → HMI/SCADA raises an alarm and logs the event with a timestamp → the condition is forwarded to maintenance rules → a maintenance work order is created (“Inspect motor M-14, bearing overheating”), including last values and operating context.
That chain is why automation is the data engine: it turns raw measurements into dependable, decision-ready signals.
Industrial software: the glue across design, planning, and production
Automation generates reliable shop-floor data, but industrial software is what turns that data into coordinated decisions across engineering, production, and operations.
The main categories (and what they actually do)
Industrial software isn’t one tool—it’s a set of systems that each “own” a piece of the workflow:
- PLM (Product Lifecycle Management): manages product definitions and changes—BOMs, configurations, approvals, and who changed what (a common Siemens example is Teamcenter).
- CAD/CAM: designs the product and prepares manufacturing methods (for example, NX for design and manufacturing).
- Simulation: tests behavior before anything is built—mechanical, thermal, flow, controls, and more (often associated with Simcenter).
- MES (Manufacturing Execution System): runs production—work orders, routing, quality checks, electronic records, and traceability.
- SCADA / HMI: supervises and visualizes machines and process data—alarms, trends, operator screens.
- Analytics: turns operational and quality data into insights like bottleneck detection, yield loss drivers, and predictive indicators.
The “digital thread” (plain-English version)
A digital thread simply means one consistent set of product and process data that follows the work—from engineering to manufacturing planning to the shop floor and back again.
Instead of recreating information in every department (and arguing over which spreadsheet is right), teams use connected systems so updates in design can flow into manufacturing plans, and manufacturing feedback can flow back into engineering.
Why it matters to the business
When these tools are connected, companies typically see practical outcomes:
- Fewer handoffs and translations, which reduces miscommunication.
- Fewer rework cycles, because manufacturability and performance issues are found earlier.
- Better traceability, because materials, process steps, and quality results are linked to the product version that was actually built.
The result is less time spent hunting for “the latest file” and more time improving throughput, quality, and change management.
Digital twins: what they are and the different types
A digital twin is best understood as a living model of something real—a product, a production line, or an asset—that stays linked to real-world data over time. The “twin” part matters: it doesn’t stop at design. As the physical thing is built, operated, and maintained, the twin is updated with what actually happened, not just what was planned.
In Siemens programs, digital twins typically sit across industrial software and automation: engineering data (like CAD and requirements), operational data (from machines and sensors), and performance data (quality, downtime, energy) are connected so teams can make decisions with a single, consistent reference.
What a digital twin is not
A twin is often confused with visuals and reporting tools. It’s helpful to draw a line:
- Not just a 3D model: A 3D view can be part of a twin, but without behavior, constraints, and data links, it’s only geometry.
- Not only a dashboard: Dashboards summarize what happened. A twin can help explain why it happened and predict what will happen next by combining models with live signals.
Common digital twin types
Different “twins” focus on different questions:
- Product twin: Represents the product definition—requirements, CAD, materials, variants, and how it should perform.
- Production/process twin: Represents how you make it—factory layout, process steps, tooling, robotics paths, cycle times, and control behavior.
- Performance/asset twin: Represents the operating asset—condition, reliability, maintenance, energy use, and degradation over time.
Typical inputs that feed a twin
A practical twin usually pulls from multiple sources:
- CAD models and drawings
- BOM (bill of materials) and variant rules
- Control logic (PLC programs, parameters, safety logic)
- Telemetry from sensors, drives, and machines (runtime, alarms, quality results)
- Maintenance history (work orders, parts replaced, failure codes)
When these inputs are connected, teams can troubleshoot faster, validate changes before applying them, and keep engineering and operations aligned.
From simulation to virtual commissioning: reducing risk before deployment
Simulation is the practice of using a digital model to predict how a product, machine, or production line will behave under different conditions. Virtual commissioning takes that one step further: you “commission” (test and tune) the automation logic against a simulated process before you touch the real equipment.
What gets tested—before anything is built or changed
In a typical setup, the mechanical design and process behavior are represented in a simulation model (often tied to a digital twin), while the control system runs the same PLC/controller program you intend to use on the shop floor.
Instead of waiting for the line to be physically assembled, the controller “drives” a virtual version of the machine. That makes it possible to validate controller logic against a simulated process:
- Are sensors and actuators mapped correctly?
- Do sequences, interlocks, and timing behave as expected?
- What happens during start-up, stop, jam handling, or emergency-stop scenarios?
Why it helps: fewer surprises, better safety and quality outcomes
Virtual commissioning can reduce late-stage rework and help teams discover issues earlier—like race conditions, missed handshakes between stations, or unsafe motion sequences. It can also support quality by testing how changes (speed, dwell times, reject logic) might affect throughput and defect handling.
This isn’t a guarantee that commissioning will be effortless, but it often shifts risk “left” into an environment where iterations are faster and less disruptive.
Example: virtually speeding up a packaging line
Imagine a manufacturer wants to increase the speed of a packaging line by 15% to meet a seasonal demand spike. Instead of pushing the change directly to production, engineers first run the updated PLC logic against a simulated line:
- They test whether infeed timing causes product collisions at higher speed.
- They check that reject gates still trigger within tolerance.
- They verify safety zones and stop categories during fault conditions.
After the virtual tests, the team deploys the refined logic during a planned window—already knowing the edge cases they need to watch. If you want more context on how models support this, see /blog/digital-twin-basics.
Edge-to-cloud architecture: how factory data reaches cloud apps
Edge-to-cloud is the path that turns real machine behavior into usable cloud data—without sacrificing uptime on the factory floor.
What “edge computing” means in a factory
Edge computing is local processing performed close to machines (often on an industrial PC or gateway). Instead of sending every raw signal to the cloud, the edge can filter, buffer, and enrich data on-site.
This matters because factories need low latency for control and high reliability even when internet connectivity is weak or interrupted.
A typical edge-to-cloud flow
A common architecture looks like this:
Device/sensor or PLC → edge gateway → cloud platform → applications
- Devices and PLCs generate signals (temperatures, speeds, counts) and status (running, faulted, changeover).
- Edge gateways collect data from industrial protocols, normalize it, and apply rules (for example, only forward changes or compute KPIs like OEE components). They also store-and-forward so you don’t lose data during network outages.
- Cloud platforms ingest and organize the data at scale.
- Apps use it for dashboards, alerts, predictive maintenance, quality tracking, energy monitoring, and cross-site benchmarking.
What industrial IoT platforms typically do
Industrial IoT (IIoT) platforms generally provide secure data ingestion, device and software fleet management (versions, health, remote updates), user access controls, and analytics services. Think of them as the operating layer that makes many factory sites manageable in a consistent way.
Time-series data basics (and why context matters)
Most machine data is time-series: values recorded over time.
- Tags are named signals (e.g., “Line1_FillTemp”).
- Sampling rates determine how often values are captured.
- Events capture discrete moments (alarms, batch start/stop, recipe change).
Raw time-series becomes far more useful when you add context—asset IDs, product, batch, shift, and work order—so cloud apps can answer operational questions, not just plot trends.
Closed-loop operations: turning cloud insights into shop-floor action
Closed-loop operations is the idea that production data doesn’t just get collected and reported—it gets used to improve the next hour, shift, or batch.
In a Siemens-style stack, automation and edge systems capture signals from machines, an MES/operations layer organizes them into work context, and cloud analytics turns patterns into decisions that flow back to the shop floor.
How MES turns real-time data into day-to-day execution
MES/operations software (for example, Siemens Opcenter) uses live equipment and process data to keep work aligned with what’s actually happening:
- Scheduling and dispatch: re-sequence orders when a line slows down, a material is late, or a changeover finishes early.
- Quality checks in context: trigger in-process inspections based on real measurements (temperature, torque, fill level), not just time.
- Exceptions and containment: automatically hold work-in-progress when a parameter drifts out of limits, before defects spread.
Traceability: the thread that makes insights actionable
Closed-loop control depends on knowing exactly what was made, how, and with which inputs.
MES traceability typically captures lots/serial numbers, process parameters, equipment used, and operator actions, building genealogy (component-to-finished-good relationships) plus audit trails for compliance. That history is what allows cloud analysis to pinpoint root causes (for example, one cavity, one supplier lot, one recipe step) rather than issuing generic recommendations.
Sending insights back to the line (without slowing it down)
Cloud insights become operational only when they return as clear, local actions: alerts to supervisors, setpoint recommendations to control engineers, or SOP updates that change how work is performed.
Ideally, the MES becomes the “delivery channel,” ensuring the right instruction reaches the right station at the right time.
Example: cloud-detected energy spikes, fixed with local control
A plant aggregates power-meter and machine-cycle data to the cloud and spots recurring energy spikes during warm-up after micro-stoppages. Analytics links the spikes to a specific restart sequence.
The team pushes a change back to the edge: adjust the restart ramp rate and add a brief interlock check in the PLC logic. The MES then monitors the updated parameter and confirms the spike pattern disappears—closing the loop from insight to control to verified improvement.
Security and governance for industrial cloud connections
Connecting factory systems to cloud applications raises a different set of risks than typical office IT: safety, uptime, product quality, and regulatory obligations.
The good news is that most “industrial cloud security” boils down to disciplined identity, network design, and clear rules for data use.
Identity and access: start with least privilege
Treat every person, machine, and application as an identity that needs explicit permissions.
Use role-based access control so operators, maintenance, engineers, and external vendors only see and do what they must. For example, a vendor account might be allowed to view diagnostics for a specific line, but not change PLC logic or download production recipes.
Where possible, use strong authentication (including MFA) for remote access, and avoid shared accounts. Shared credentials make it impossible to audit who changed what—and when.
Network segmentation beats “air-gapped” thinking
Many plants still talk about being “air-gapped,” but real operations often require remote support, supplier portals, quality reporting, or corporate analytics.
Instead of relying on isolation that tends to erode over time, design segmentation intentionally. A common approach is separating the enterprise network from the OT network, then creating controlled zones (cells/areas) with tightly managed pathways between them.
The goal is simple: limit blast radius. If a workstation is compromised, it should not automatically provide a route to controllers across the entire site.
Data governance: decide what data is—and who can use it
Before streaming data to the cloud, define:
- What data leaves the plant (process values, alarms, energy, quality, recipes)
- The purpose for each dataset (maintenance, OEE, traceability, optimization)
- Who can access it (plant, corporate, suppliers, integrators)
Clarify ownership and retention early. Governance is not just compliance—it prevents “data sprawl,” duplicate dashboards, and arguments about which numbers are official.
Patching and updates: plan staged rollouts
Plants can’t patch like laptops. Some assets have long validation cycles, and unplanned downtime is expensive.
Use a staged rollout: test updates in a lab or pilot line, schedule maintenance windows, and keep rollback plans. For edge devices and gateways, standardize images and configurations so you can update consistently across sites without surprises.
A practical adoption roadmap: pilot to scale
A good industrial cloud program is less about a “big bang” platform rollout and more about building repeatable patterns. Treat your first project as a template you can copy—technically and operationally.
1) Start small: one asset, one problem, one metric
Pick a single production line, machine, or utility system where the business impact is clear.
Define one priority problem (for example: unplanned downtime on a packaging line, scrap on a forming station, or excessive energy use in compressed air).
Choose one metric to prove value fast: OEE loss hours, scrap rate, kWh per unit, mean time between failures, or changeover time. The metric becomes your “north star” for the pilot and your baseline for scale.
2) Readiness checklist (before you connect anything)
Most pilots stall due to basic data issues, not the cloud.
- Sensor coverage: Are the signals you need actually measured (and reliable)?
- Tag quality: Do tags reflect what they claim (units, scaling, status logic)?
- Naming conventions: Can a new engineer understand tag names without tribal knowledge?
- Time synchronization: Are PLCs, SCADA, historians, and gateways aligned to the same clock?
If these aren’t in place, fix them early—automation and industrial software can only be as effective as the data feeding them.
3) Plan the integration steps: connect → contextualize → visualize → analyze → automate
- Connect: Securely capture signals and events from OT systems.
- Contextualize: Map raw tags to assets, states, and production context (product, batch, shift).
- Visualize: Give operators and supervisors simple dashboards that match how work is done.
- Analyze: Identify patterns (loss drivers, quality drift, energy peaks) and test hypotheses.
- Automate: Close the loop with alarms, recommended actions, or control changes—carefully governed.
If you expect to build custom internal tools (for example, lightweight production dashboards, exception queues, maintenance triage apps, or data-quality checkers), it helps to have a fast path from idea to working software. Teams increasingly prototype these “glue apps” with a chat-driven platform like Koder.ai, then iterate once the data model and users’ workflows are validated.
4) Define success criteria—and a scaling plan
Document what “done” means: target improvement, payback window, and who owns ongoing tuning.
To scale, standardize three things: an asset/tag template, a deployment playbook (including cybersecurity and change management), and a shared KPI model across sites. Then expand from one line to one area, then to multiple plants with the same pattern.
Conclusion: what to do next (and what to measure)
Connecting shop-floor assets to cloud analytics works best when you treat it as a system, not a single project. A useful mental model is:
- Automation provides truth: sensors, PLCs, drives, and SCADA capture what actually happened—cycle times, alarms, setpoints, states.
- Software provides context: MES, PLM, and scheduling explain why it happened—product, batch, routing, work instructions, genealogy.
- Digital twins provide prediction: simulation models help you test changes before you disrupt production—throughput, energy use, quality risk.
Quick wins you can deliver in weeks
Start with outcomes that rely on data you already have:
- OEE visibility (availability, performance, quality) with consistent downtime reasons.
- Condition monitoring for critical assets (vibration, temperature, power draw) and alerting based on simple thresholds.
- Changeover optimization by measuring real changeover steps and losses, then standardizing best practices.
What to evaluate when choosing tools
Whether you standardize on Siemens solutions or integrate multiple vendors, evaluate:
- Interoperability: how easily OT signals map into MES/PLM and analytics without custom one-offs.
- Openness: support for common standards/APIs so you can add tools later.
- A clear data model: consistent definitions for asset, line, order, batch, material, and quality.
- Support and ecosystem: implementation partners, training, and long-term product roadmap.
Also consider how quickly you can deliver the last-mile applications that make insights usable on the floor. For some teams, that means combining core industrial platforms with rapid app development (for example, building a React-based web interface plus a Go/PostgreSQL backend and deploying it quickly). Koder.ai is one way to do that through a chat interface, while still keeping the option to export source code and control deployment.
Next-step questions to ask internally
Use these to move from “interesting pilot” to measurable scale:
- People: Who owns OT data quality, and who owns business KPIs?
- Process: Which decisions will be automated vs. guided?
- Data: What are the “golden tags” and master data you must standardize first?
- Security: How will you segment networks, manage identities, and audit access?
Measure progress with a small scorecard: OEE change, unplanned downtime hours, scrap/rework rate, energy per unit, and engineering change cycle time.
FAQ
What does “connecting the physical economy to the cloud” actually mean?
It means creating a working loop where real-world operations (machines, utilities, logistics) send reliable signals to software that can analyze and coordinate them, and then turn insights into actions back on the shop floor (setpoints, work instructions, maintenance tasks). The goal is outcomes—uptime, quality, throughput, energy—not “uploading everything.”
Do we need to send all machine data to the cloud to get value?
Start with one use case and only the data required:
- Need fast control? Keep it in PLC/SCADA; send summaries or events to the cloud.
- Need cross-site comparison or advanced analytics? Send contextualized KPIs and key signals.
- Need traceability? Send batch/lot events + critical parameters, not every millisecond sample.
A practical rule: collect high-frequency data locally, then forward events, changes, and computed KPIs to the cloud.
What are Siemens’ “three pillars” in plain terms?
Think of it as three layers working together:
- Automation: sensors/PLCs/drives/HMI—where data is born and where actions must ultimately happen.
- Industrial software: PLM/MES/simulation—adds lifecycle and production context so data becomes decisions.
- Digital twins: models linked to real data—used to test changes and predict impacts before deploying.
The value comes from the closed loop across all three, not any single layer alone.
What does a typical edge-to-cloud architecture look like in a factory?
A useful “diagram in words” is:
- PLC/sensors produce signals and states.
- Edge gateway collects, normalizes, buffers (store-and-forward), and may compute KPIs.
- Cloud platform ingests and organizes data at scale.
- Apps/analytics generate dashboards, alerts, recommendations.
- Actions return via MES/SCADA/workflows to operators, maintenance, or engineering.
Design for reliability: the plant should keep running even if the cloud link is down.
Why is OT/IT integration so hard in practice?
Common sources of friction:
- Protocol diversity (OPC UA, PROFINET, Modbus, legacy drivers).
- Lack of context (tags like
T_001without asset/product/batch mapping). - Data mismatch (high-frequency time-series vs business transactions like orders and batches).
- Security priorities differ (OT availability vs IT confidentiality/patch cadence).
Most integration work is “translation + context + governance,” not just networking.
What’s the role of a standard data model, and how do we start one?
Connectivity alone gives you trends; a data model gives you meaning. At minimum, define:
- Asset hierarchy (site → area → line → machine → component)
- Consistent tag naming and units/scaling
- Event definitions (downtime, alarms, batch start/stop)
- Shared identifiers (asset IDs, product/batch/work order keys)
With a stable model, dashboards and analytics become reusable across lines and plants instead of one-off projects.
What is a digital twin (and what is it not)?
A digital twin is a living model linked to real operational data over time. Common types:
- Product twin: requirements/CAD/BOM/variants and expected performance.
- Production/process twin: layout, tooling, robotics paths, cycle times, control behavior.
- Performance/asset twin: condition, energy use, reliability, degradation, maintenance history.
A twin is not just a 3D model (geometry only) and not just a dashboard (reporting without predictive behavior).
How does virtual commissioning reduce risk before deployment?
Virtual commissioning tests the real control logic (PLC program) against a simulated process/line before touching physical equipment. It helps you:
- Validate sequences, interlocks, and timing
- Catch edge cases (startup/stop, jams, E-stops)
- Reduce late-stage rework and commissioning surprises
It won’t eliminate all on-site commissioning, but it typically shifts risk earlier when iterations are faster.
What’s a practical pilot-to-scale roadmap for industrial cloud adoption?
Use a “one asset, one problem, one metric” approach:
- Choose a clear target (downtime, scrap, energy per unit, changeover time).
- Confirm readiness: sensor coverage, tag quality, naming conventions, time sync.
- Execute steps: connect → contextualize → visualize → analyze → automate.
- Define success criteria and document a reusable template.
For a deeper rollout path, see /blog/a-practical-adoption-roadmap-pilot-to-scale.
What security and governance practices matter most for connecting plants to the cloud?
Focus on disciplined basics:
- Least privilege access with role-based permissions; avoid shared accounts; use MFA for remote access.
- Network segmentation (enterprise vs OT zones; controlled pathways) to limit blast radius.
- Data governance: what leaves the plant, purpose, who can use it, retention/ownership.
- Staged patching with testing, maintenance windows, and rollback plans—especially for edge gateways.
Security succeeds when it’s designed for uptime, safety, and auditability—not just IT convenience.