Jun 23, 2025·8 min
Snowflake’s Storage/Compute Split: Performance and Ecosystems
Learn how Snowflake popularized separating storage and compute, how it changed scaling and cost tradeoffs, and why ecosystems matter as much as speed.
Learn how Snowflake popularized separating storage and compute, how it changed scaling and cost tradeoffs, and why ecosystems matter as much as speed.
Snowflake popularized a simple but far-reaching idea in cloud data warehousing: keep data storage and query compute separate. That split changes two everyday pain points for data teams—how warehouses scale and how you pay for them.
Instead of treating the warehouse like one fixed “box” (where more users, more data, or more complex queries all fight for the same resources), Snowflake’s model lets you store data once and spin up the right amount of compute when you need it. The result is often faster time-to-answer, fewer bottlenecks during peak usage, and clearer control over what costs money (and when).
This post explains, in plain language, what it really means to separate storage and compute—and how that affects:
We’ll also point out where the model doesn’t magically solve everything—because some cost and performance surprises come from how workloads are designed, not the platform itself.
A fast platform isn’t the whole story. For many teams, time-to-value depends on whether you can easily connect the warehouse to the tools you already use—ETL/ELT pipelines, BI dashboards, catalog/governance tools, security controls, and partner data sources.
Snowflake’s ecosystem (including data sharing patterns and marketplace-style distribution) can shorten implementation timelines and reduce custom engineering. This post covers what “ecosystem depth” looks like in practice, and how to evaluate it for your organization.
This guide is written for data leaders, analysts, and non-specialist decision makers—anyone who needs to understand the trade-offs behind Snowflake architecture, scaling, cost, and integration choices without getting buried in vendor jargon.
Traditional data warehouses were built around a simple assumption: you buy (or rent) a fixed amount of hardware, then run everything on that same box or cluster. That worked well when workloads were predictable and growth was gradual—but it created structural limits once data volumes and user counts accelerated.
On-prem systems (and early cloud “lift-and-shift” deployments) typically looked like this:
Even when vendors offered “nodes,” the core pattern stayed the same: scale usually meant adding bigger or more nodes to one shared environment.
This design creates a few common headaches:
Because these warehouses were tightly coupled to their environments, integrations often grew organically: custom ETL scripts, hand-built connectors, and one-off pipelines. They worked—until a schema changed, an upstream system moved, or a new tool was introduced. Keeping everything running could feel like constant maintenance rather than steady progress.
Traditional data warehouses often tie two very different jobs together: storage (where your data lives) and compute (the horsepower that reads, joins, aggregates, and writes that data).
Storage is like a long-term pantry: tables, files, and metadata are kept safely and cheaply, designed to be durable and always available.
Compute is like the kitchen staff: it’s the set of CPUs and memory that actually “cooks” your queries—running SQL, sorting, scanning, building results, and handling multiple users at once.
Snowflake separates these two so you can adjust each one without forcing the other to change.
Practically, this changes day-to-day operations: you don’t have to “overbuy” compute just because storage is growing, and you can isolate workloads (for example, analysts vs. ETL jobs) so they don’t slow each other down.
This separation is powerful, but it’s not magic.
The value is control: paying for storage and compute on their own terms, and matching each to what your teams actually need.
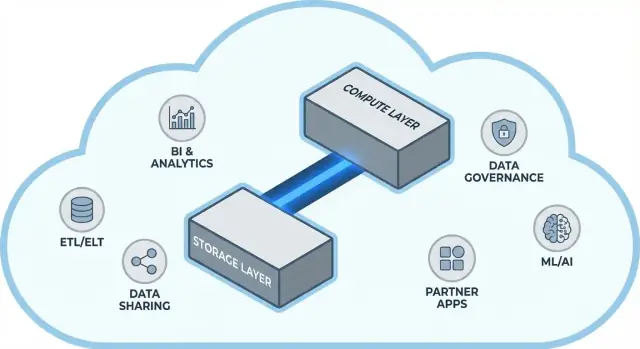
Snowflake is easiest to understand as three layers that work together, but can scale independently.
Your tables ultimately live as data files in your cloud provider’s object storage (think S3, Azure Blob, or GCS). Snowflake manages the file formats, compression, and organization for you. You don’t “attach disks” or size storage volumes—storage grows as data grows.
Compute is packaged as virtual warehouses: independent clusters of CPU/memory that execute queries. You can run multiple warehouses against the same data at the same time. That’s the key difference from older systems where heavy workloads tended to fight over the same pool of resources.
A separate services layer handles the “brains” of the system: authentication, query parsing and optimization, transaction/metadata management, and coordination. This layer decides how to run a query efficiently before compute touches the data.
When you submit SQL, Snowflake’s services layer parses it, builds an execution plan, and then hands that plan to a chosen virtual warehouse. The warehouse reads only the necessary data files from object storage (and benefits from caching when possible), processes them, and returns results—without permanently moving your base data into the warehouse.
If many people run queries at once, you can either:
That’s the architectural foundation behind Snowflake’s performance and “noisy neighbor” control.
Snowflake’s big practical shift is that you scale compute independently from data. Instead of “the warehouse is getting bigger,” you get the ability to dial resources up or down per workload—without copying tables, repartitioning disks, or scheduling downtime.
In Snowflake, a virtual warehouse is the compute engine that runs queries. You can resize it (e.g., from Small to Large) in seconds, and the data stays put in shared storage. That means performance tuning often becomes a simple question: “Does this workload need more horsepower right now?”
This also enables temporary bursts: scale up for a month-end close, then scale back down when the spike is over.
Traditional systems often force different teams to share the same compute, which turns busy hours into a line at the cashier.
Snowflake lets you run separate warehouses per team or per workload—for example, one for analysts, one for dashboards, and one for ETL. Since these warehouses read the same underlying data, you reduce the “my dashboard slowed your report” problem and make performance more predictable.
Elastic compute isn’t automatic success. Common gotchas include:
The net change: scaling and concurrency move from infrastructure projects to day-to-day operating decisions.
Snowflake’s “pay for what you use” is basically two meters running in parallel:
This split is where savings can happen: you can keep lots of data relatively cheaply while turning compute on only when you need it.
Most “unexpected” spend comes from compute behaviors rather than raw storage. Common drivers include:
Separating storage and compute doesn’t automatically make queries efficient—bad SQL can still burn credits quickly.
You don’t need a finance department to manage this—just a few guardrails:
Used well, the model rewards discipline: short-running, right-sized compute paired with predictable storage growth.
Snowflake treats sharing as something you design into the platform—not an afterthought bolted onto exports, file drops, and one-off ETL jobs.
Instead of sending extracts around, Snowflake can let another account query the same underlying data through a secure “share.” In many scenarios, the data doesn’t need to be duplicated into a second warehouse or pushed to object storage for download. The consumer sees the shared database/table as if it were local, while the provider stays in control of what’s exposed.
This “decoupled” approach is valuable because it reduces data sprawl, speeds up access, and lowers the number of pipelines you have to build and maintain.
Partner and customer sharing: A vendor can publish curated datasets to customers (for example, usage analytics or reference data) with clear boundaries—only the permitted schemas, tables, or views.
Internal domain sharing: Central teams can expose certified datasets to product, finance, and operations without making every team build their own copies. That supports a “one set of numbers” culture while still letting teams run their own compute.
Governed collaboration: Joint projects (e.g., with an agency, supplier, or subsidiary) can work off a shared dataset while keeping sensitive columns masked and access logged.
Sharing isn’t “set it and forget it.” You still need:
A fast warehouse is valuable, but speed alone rarely determines whether a project ships on time. What often makes the difference is the ecosystem around the platform: the ready-made connections, tools, and know-how that reduce custom work.
In practice, an ecosystem includes:
Benchmarks measure a narrow slice of performance under controlled conditions. Real projects spend most time on:
If your platform has mature integrations for these steps, you avoid building and maintaining glue code. That typically shortens implementation timelines, improves reliability, and makes it easier to switch teams or vendors without rewriting everything.
When assessing an ecosystem, look for:
Performance gets you capability; ecosystem often determines how quickly you can turn that capability into business outcomes.
Snowflake can run fast queries, but value shows up when data reliably moves through your stack: from sources, into Snowflake, and back out into tools that people use every day. The “last mile” is usually what determines whether a platform feels effortless—or constantly fragile.
Most teams end up needing a mix of:
Not all “Snowflake-compatible” tools behave the same. During evaluation, focus on practical details:
Integrations also need day-2 readiness: monitoring and alerting, lineage/catalog hooks, and incident response workflows (ticketing, on-call, runbooks). A strong ecosystem isn’t just more logos—it’s fewer surprises when pipelines fail at 2 a.m.
As teams grow, the hardest part of analytics often isn’t speed—it’s making sure the right people can access the right data, for the right purpose, with proof that controls are working. Snowflake’s governance features are designed for that reality: lots of users, lots of data products, and frequent sharing.
Start with clear roles and a least-privilege mindset. Instead of granting access directly to individuals, define roles like ANALYST_FINANCE or ETL_MARKETING, then grant those roles access to specific databases, schemas, tables, and (when needed) views.
For sensitive fields (PII, financial identifiers), use masking policies so people can query datasets without seeing raw values unless their role allows it. Pair that with auditing: track who queried what, and when, so security and compliance teams can answer questions without guesswork.
Good governance makes data sharing safer and more scalable. When your sharing model is built on roles, policies, and audited access, you can confidently enable self-service (more users exploring data) without opening the door to accidental exposure.
It also reduces friction for compliance efforts: policies become repeatable controls rather than one-off exceptions. That matters when datasets are reused across projects, departments, or external partners.
PROD_FINANCE, DEV_MARKETING, SHARED_PARTNER_X). Consistency speeds up reviews and reduces mistakes.Trust at scale is less about one “perfect” control and more about a system of small, dependable habits that keep access intentional and explainable.
Snowflake tends to shine when many people and tools need to query the same data for different reasons. Because compute is packaged into independent “warehouses,” you can map each workload to a shape and schedule that fits.
Analytics & dashboards: Put BI tools on a dedicated warehouse sized for steady, predictable query volume. This keeps dashboard refreshes from being slowed down by ad hoc exploration.
Ad hoc analysis: Give analysts a separate warehouse (often smaller) with auto-suspend enabled. You get fast iteration without paying for idle time.
Data science & experimentation: Use a warehouse sized for heavier scans and occasional bursts. If experiments spike, scale this warehouse up temporarily without affecting BI users.
Data apps & embedded analytics: Treat app traffic like a production service—separate warehouse, conservative timeouts, and resource monitors to prevent surprise spend.
If you’re building lightweight internal data apps (for example, an ops portal that queries Snowflake and displays KPIs), a fast path is to generate a working React + API scaffold and iterate with stakeholders. Platforms like Koder.ai (a vibe-coding platform that builds web/server/mobile apps from chat) can help teams prototype these Snowflake-backed apps quickly, then export source code when you’re ready to operationalize.
A simple rule: separate warehouses by audience and purpose (BI, ELT, ad hoc, ML, app). Pair that with good query habits—avoid broad SELECT *, filter early, and watch for inefficient joins. On the modeling side, prioritize structures that match how people query (often a clean semantic layer or well-defined marts), rather than over-optimizing physical layouts.
Snowflake is not a replacement for everything. For high-throughput, low-latency transactional workloads (typical OLTP), a specialized database is usually a better fit, with Snowflake used for analytics, reporting, sharing, and downstream data products. Hybrid setups are common—and often the most practical.
A Snowflake migration is rarely “lift and shift.” The storage/compute split changes how you size, tune, and pay for workloads—so planning upfront prevents surprises later.
Start with an inventory: what data sources feed the warehouse, which pipelines transform it, which dashboards depend on it, and who owns each piece. Then prioritize by business impact and complexity (e.g., critical finance reporting first, experimental sandboxes later).
Next, convert SQL and ETL logic. Much of standard SQL transfers, but details like functions, date handling, procedural code, and temp-table patterns often need rewrites. Validate results early: run parallel outputs, compare row counts and aggregates, and confirm edge cases (nulls, time zones, dedup logic). Finally, plan cutover: a freeze window, a rollback path, and a clear “definition of done” for each dataset and report.
Hidden dependencies are the most common: a spreadsheet extract, a hard-coded connection string, a downstream job no one remembers. Performance surprises can happen when old tuning assumptions don’t apply (e.g., overusing tiny warehouses, or running many small queries without considering concurrency). Cost spikes usually come from leaving warehouses running, uncontrolled retries, or duplicative dev/test workloads. Permission gaps appear when migrating from coarse roles to more granular governance—tests should include “least privilege” user runs.
Set an ownership model (who owns data, pipelines, and cost), deliver role-based training for analysts and engineers, and define a support plan for the first weeks after cutover (on-call rotation, incident runbook, and a place to report issues).
Choosing a modern data platform isn’t just about peak benchmark speed. It’s about whether the platform fits your real workloads, your team’s ways of working, and the tools you already rely on.
Use these questions to guide your shortlist and vendor conversations:
Pick two or three representative datasets (not toy samples): one large fact table, one messy semi-structured source, and one “business critical” domain.
Then run real user queries: dashboards at morning peak, analyst exploration, scheduled loads, and a few worst-case joins. Track: query time, concurrency behavior, time-to-ingest, operational effort, and cost per workload.
If part of your evaluation includes “how quickly can we ship something people actually use,” consider adding a small deliverable to the pilot—like an internal metrics app or a governed data-request workflow that queries Snowflake. Building that thin layer often reveals integration and security realities faster than benchmarks alone, and tools like Koder.ai can speed up the prototype-to-production cycle by generating the app structure via chat and letting you export the code for long-term maintenance.
If you want help estimating spend and comparing options, start with /pricing.
For migration and governance guidance, browse related articles in /blog.
Snowflake stores your data in cloud object storage and runs queries on separate compute clusters called virtual warehouses. Because storage and compute are decoupled, you can scale compute up/down (or add more warehouses) without moving or duplicating the underlying data.
It reduces resource contention. You can isolate workloads by putting them on different virtual warehouses (e.g., BI vs. ETL), or use multi-cluster warehouses to add compute during spikes. This helps avoid the “one shared cluster” queueing problem common in traditional MPP setups.
Not automatically. Elastic compute gives you control, but you still need guardrails:
Bad SQL, constant dashboard refreshes, or always-on warehouses can still drive high compute costs.
Billing is typically split into two main components:
This makes it easier to see what costs money right now (compute) versus what grows more steadily (storage).
Common culprits are operational rather than “data size”:
A few practical controls (auto-suspend, monitors, scheduling) usually deliver outsized savings.
It’s the delay when a suspended warehouse starts back up to run a query/job. If you have infrequent workloads, auto-suspend saves money but may add a small latency penalty on the first query after idle time. For user-facing dashboards, consider a dedicated warehouse sized for steady demand rather than frequent suspend/resume cycles.
A virtual warehouse is an independent compute cluster that executes SQL. Best practice is to map warehouses to audiences/purposes, for example:
This isolates performance and makes cost ownership clearer.
Often, yes. Snowflake sharing can let another account query data you expose (tables/views) without you exporting files or building extra pipelines. You still need strong governance—clear ownership, access reviews, and policies for sensitive fields—so sharing stays controlled and auditable.
Because delivery time is usually dominated by integration and operations work, not raw query speed. A strong ecosystem can reduce custom engineering via:
That can shorten implementation timelines and lower day-2 maintenance burden.
Use a small, realistic pilot (often 2–4 weeks):
If you need help estimating spend, start at /pricing, and for related guidance browse /blog.