

Website Speed for Beginners: What Actually Improves Load Time
A beginner-friendly guide to what really improves website load time: images, caching, hosting, code, and Core Web Vitals—plus quick wins to try first.
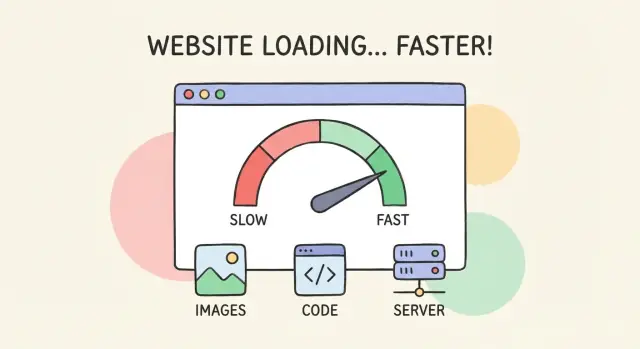
What “Website Speed” Really Means
When people say “my website is slow,” they usually mean one of two things:
- The page takes too long to start showing anything, or
- It looks ready but still feels unresponsive (buttons lag, images pop in late, the page jumps around).
“Load time” isn’t a single stopwatch number. A page loads in stages: your browser requests files (HTML, images, fonts, scripts), downloads them, and then turns them into a usable page. You can think of it like opening a shop: unlocking the door, turning on lights, stocking shelves, and finally being ready to serve customers.
Why speed matters (beyond “it’s nice”)
Speed affects:
- Users: Slow pages feel stressful on mobile and spotty connections. People leave sooner, and they trust the site less.
- SEO: Google uses speed-related signals (including Core Web Vitals) as part of page experience. A faster site won’t automatically rank #1, but a slow one can hold you back.
- Conversions: Every extra delay adds friction—fewer sign-ups, fewer purchases, fewer form submissions.
Set expectations: most wins come from a few places
You don’t need 50 micro-optimizations. For most beginner sites, the biggest improvements come from a short list: images, too much JavaScript/CSS, third-party widgets, and server/hosting response time.
What this guide will (and won’t) cover
This guide focuses on practical, low-risk steps that improve real-world page load time, especially on mobile. It won’t dive deep into advanced topics like rewriting your app architecture, building custom caching layers, or performance budgeting for large engineering teams. The goal is to help you make changes you can actually finish—and verify—without breaking your site.
Key Speed Metrics to Know (Without the Jargon)
When people say “my site is slow,” they usually mean one of three things: the main content shows up late, the page feels laggy when they tap, or the layout keeps jumping around. Google’s Core Web Vitals map neatly to those complaints.
The three Core Web Vitals
LCP (Largest Contentful Paint): how long it takes for the biggest “main” thing (often a hero image or headline block) to appear. If LCP is high, users stare at a mostly-empty page.
INP (Interaction to Next Paint): how quickly the page responds after a user interacts (tap, click, type). If INP is high, the site feels sticky—buttons react late, menus open with a delay.
CLS (Cumulative Layout Shift): how much the page jumps while loading. If text shifts and you mis-tap a button, that’s CLS.
TTFB: the “first response” time
TTFB (Time to First Byte) is how long it takes your server (and everything in between) to start sending anything back. A slow TTFB delays everything else: images can’t start downloading, fonts can’t load, and LCP usually gets worse. TTFB problems often point to hosting, heavy backend work, or missed caching.
Lab tests vs. real-user data
Lab tests (like Lighthouse) simulate a page load under set conditions. They’re great for debugging and before/after comparisons.
Real-user data (often called “field data,” like CrUX in PageSpeed Insights) reflects what visitors actually experience across devices and networks. This is what matters most for the question: “Does it feel fast for real people?”
“Good enough” beginner targets
- LCP: aim for ≤ 2.5s (up to 4.0s needs work)
- INP: aim for ≤ 200ms (up to 500ms needs work)
- CLS: aim for ≤ 0.10 (above 0.25 is a problem)
- TTFB: aim for ≤ 0.8s (above 1.8s is often noticeably slow)
How to Measure Your Site Before You Change Anything
If you start “optimizing” without a baseline, it’s easy to waste time—or accidentally make the site slower. Take 20 minutes to measure first, then you’ll know which changes helped.
Run PageSpeed Insights (quick reality check)
Use PageSpeed Insights for a fast snapshot. It reports field data (real-user experience, when available) and lab data (a simulated test). Pay attention to:
- Mobile vs. desktop results (mobile is usually the pain point)
- The “Opportunities” list (good for ideas, not a strict to-do list)
- Whether the test has real-user data for your URL
For deeper lab testing, run Lighthouse in Chrome:
- Open DevTools → Lighthouse
- Choose Mobile and Performance
- Run it 2–3 times and keep the middle result (tests vary)
Use WebPageTest for the “waterfall”
When you need to see what is delaying the page, WebPageTest is one of the clearest tools. The waterfall view shows every file loading in order—HTML, images, fonts, scripts, and third-party tags—and where the browser is waiting.
Start with one key page (homepage or top landing page) and test:
- First View (cold cache) and Repeat View (cached)
- A mobile device profile when possible
Record your test conditions (so results mean something)
Write down for each test:
- Device (your laptop, a mid-range phone, etc.)
- Network (Wi‑Fi, 4G, throttled settings)
- Location (test region in WebPageTest)
- Exact URL (including parameters)
Make a simple before/after checklist
Create a small log (a spreadsheet is fine): date, tool used, URL, results, and what changed. Only change one or two things at a time, then re-test under the same conditions.
If you’re iterating on an app (not just a static site), it helps to have a safe way to ship and roll back performance experiments. Platforms like Koder.ai (which can generate and host React/Go apps from a chat workflow) are useful here because you can take snapshots, test changes, and roll back quickly if a “speed fix” accidentally breaks UX.
The Most Common Reasons Pages Load Slowly
Slow pages usually aren’t caused by one mysterious issue. They’re the result of a few common “weight and delay” problems that stack up—especially on mobile.
1) Images that are bigger than they need to be
Images are often the heaviest part of a page. A single hero image exported at the wrong size (or in an older format) can add megabytes and seconds.
Common culprits include:
- Uploading a 4000px-wide photo when the site displays it at 1200px
- Using PNGs for photos instead of modern formats like WebP/AVIF
- Serving the same large image to both desktop and mobile
2) Too much JavaScript (and too many add-ons)
JavaScript can delay how quickly a page becomes usable. Even if the page “shows up,” it may feel sluggish while scripts load, parse, and run.
Third-party scripts are frequent offenders: chat widgets, pop-ups, heatmaps, A/B testing tools, ad tags, and social embeds. Each one can add extra network calls and can delay critical browser work.
3) Slow hosting or heavy server work
Sometimes the browser is waiting on your server before it can even start loading the page. This is often felt as a slow initial response (TTFB). Causes include underpowered hosting, busy databases, unoptimized themes/plugins, or pages that build dynamically on every visit.
4) No caching + too many requests
If your site forces every visit to start from zero, repeat visitors get punished. Without caching, the server rebuilds pages repeatedly and the browser re-downloads files that rarely change.
Also, lots of small files (fonts, scripts, styles, trackers) create “request overhead.” Even if each file is small, the combined waiting time adds up.
The good news: these causes are fixable—and you’ll usually get the biggest gains by addressing them in this order.
Images: The Fastest, Most Reliable Speed Win
If you only make one performance improvement, make it images. On many beginner sites, images account for most of the downloaded “weight” of a page—especially on mobile. The good news: image fixes are usually safe, quick, and don’t require changing your design.
1) Resize images to the displayed size
A common mistake is uploading a huge photo (say, 4000px wide) and displaying it at 800px. The browser still has to download the big file.
Aim to export images close to the maximum size they’ll actually appear on your site. For example, if your blog content area is 800px wide, don’t upload 3000–4000px images “just in case.”
2) Use modern formats (WebP/AVIF) when possible
JPEG and PNG still work, but modern formats often deliver the same visual quality at a much smaller file size.
- WebP is widely supported and a great default.
- AVIF can be even smaller, but encoding can be slower and support varies more.
If your CMS or image plugin can automatically serve WebP/AVIF with fallbacks, that’s ideal.
3) Compress images and remove unnecessary metadata
Compression is where most of the immediate page load time wins happen. A “visually identical” image can often be reduced by 30–70%.
Also remove metadata you don’t need (camera info, location data). It won’t change how the image looks, but it adds bytes.
Practical rule: compress until you see a noticeable quality drop, then step back one level.
4) Use responsive images (srcset) for mobile vs. desktop
Mobile users shouldn’t download desktop-sized images. Responsive images let the browser pick the right size based on screen width.
If your site generates multiple image sizes automatically, make sure your theme uses them properly. What you’re looking for in the page HTML is something like srcset (multiple versions) rather than a single giant file.
Quick checklist
Before moving on to more advanced tuning (like minifying code), audit just your top images:
- Are they sized for where they appear?
- Are they served as WebP/AVIF when possible?
- Are they compressed sensibly?
- Do mobile devices get smaller versions?
Do those four things consistently, and your website speed and page load time will usually improve immediately—often enough to move Core Web Vitals in the right direction.
Lazy Loading and Above-the-Fold Priorities
Lazy loading means your page delays downloading some images (and sometimes iframes) until they’re close to appearing on screen. That can cut initial page load time because the browser isn’t fetching everything at once—especially helpful on long pages with lots of images below the fold.
When lazy loading helps
Lazy loading is most useful for:
- Product grids, blog posts, and landing pages with lots of content below the first screen
- Embedded videos/maps that aren’t immediately needed
- Mobile visitors on slower connections
Used well, it reduces “work up front” and helps the page feel faster.
Don’t lazy-load your hero (protect LCP)
Your largest above-the-fold image is often the hero image. If you lazy-load it, the browser may wait too long to request it, which can hurt Largest Contentful Paint (LCP).
Rule of thumb: never lazy-load the main hero image or anything critical in the first screen (headline image, primary product photo, top banner).
Prevent layout shifts with width/height
Lazy loading can accidentally cause “jumping” as images appear. To prevent layout shifts (CLS), always reserve space:
- Set
widthandheighton images, or - Use CSS with a fixed aspect ratio
That way the page layout stays stable while images load.
Preload what truly matters
If an above-the-fold image or font is essential to the first impression, consider preloading it so the browser grabs it early. Use this sparingly—preloading too much can backfire by competing for bandwidth.
If you want a checklist approach, pair this with your measurement step in /blog/how-to-measure-site-speed-before-you-change-anything.
Caching Basics: Make Repeat Visits Much Faster
Caching is the browser’s way of saying: “I’ve already downloaded this—can I reuse it?” Instead of re-downloading the same logo, CSS file, or JavaScript bundle on every page view (or every visit), the browser keeps a local copy for a while. That makes repeat visits noticeably faster and reduces data usage—especially on mobile.
Browser caching, in plain English
When your site sends a file (like styles.css or app.js), it can also send instructions about how long that file can be reused. If the browser is allowed to keep it for, say, 30 days, then the next time someone visits your site, those files load instantly from their device rather than from your server.
This doesn’t magically speed up the very first visit, but it can dramatically speed up:
- The second page someone clicks
- Repeat visits over the next few days/weeks
- Users with spotty connections
Set cache headers for “static” files
Static files are things that don’t change every minute: images, CSS, JavaScript, fonts. These are perfect candidates for longer cache times.
What you want (conceptually):
- CSS/JS/images: cache for a long time (weeks/months)
- HTML pages: cache carefully (often short), because content can change and you don’t want people seeing an old version
Your host, CMS, or framework may offer a simple “static asset caching” toggle. If you’re working with a developer, ask them to set appropriate Cache-Control headers for assets.
Use versioned filenames so updates don’t get stuck
A common worry is: “If we cache files for a month, how will users get our updated design tomorrow?” The solution is versioned filenames.
Instead of reusing app.js forever, your build process (or developer) can output something like:
app.3f2a1c.jsstyles.a81b09.css
When the content changes, the filename changes, so the browser treats it as a brand-new file and downloads it immediately—while still caching older versions safely.
A note on service workers (advanced)
Service workers can take caching even further by letting your site control what gets stored and when, sometimes enabling offline behavior. They can also cause confusing “stale content” issues if implemented poorly. If you’re a beginner, treat service workers as an advanced option—great when you have clear goals and someone experienced to maintain them.
CDNs Explained: When They Help (and When They Don’t)
A CDN (Content Delivery Network) is a group of servers spread across different regions that can deliver your site’s files from a location closer to the visitor. Instead of every request traveling all the way to your single hosting server, many requests are handled “nearby.”
What a CDN actually does
CDNs are best at speeding up static assets—things that don’t change on every request—like images, CSS, JavaScript files, fonts, and videos. These files can be copied (“cached”) to CDN servers and reused for many visitors.
Who benefits most: sites with visitors in multiple cities/countries, media-heavy sites, and any business running paid campaigns that send traffic from all over.
How CDNs reduce latency for global visitors
Distance adds delay. If your server is in one country and your visitor is on another continent, every file request takes longer. A CDN reduces that delay by serving cached files from an edge server closer to the visitor, which usually improves page load time and can help Core Web Vitals—especially on mobile connections.
Static assets vs. dynamic pages
- Static assets: great CDN fit. Cache them aggressively.
- Dynamic pages (shopping cart, account area): often can’t be cached safely, or only parts can. Some CDNs support “dynamic acceleration,” but that’s more advanced and not a guaranteed win.
Common pitfalls to watch
Misconfigured cache headers can stop caching entirely (or cache too little). The opposite problem is stale cache: you update a file, but visitors still get the old version. To avoid this, use cache-busting filenames (like app.1234.js) and learn your CDN’s “purge” feature.
A CDN isn’t a substitute for fixing heavy images, bloated scripts, or slow hosting—but it can be a strong multiplier once the basics are in place.
Trim CSS and JavaScript Without Breaking the Site
CSS and JavaScript are often the “invisible weight” that slows a page down. Unlike images, you can’t always see the problem—but your browser still has to download, process, and execute these files before the page feels ready.
Minify CSS and JavaScript (what it changes, what it doesn’t)
Minifying removes extra spaces, comments, and formatting. It usually makes files smaller and faster to download.
What it does change: file size.
What it doesn’t change: how much work the browser must do to parse and run the code. If your scripts do too much on load, minification won’t fix that—so think of minify as a quick win, not a complete solution.
Remove unused CSS and ship only what the page needs
Many sites load a “one size fits all” stylesheet that includes rules for pages, components, and features the current page doesn’t use. That extra CSS still gets downloaded and can slow down rendering.
A practical approach:
- If you use a page builder or a big theme, look for options like “load assets per page” or “only load used CSS.”
- If you have a developer, ask for “critical CSS” (small styles needed for the first screen) and delayed loading of the rest.
The goal is simple: the homepage shouldn’t carry the weight of your entire site.
Defer or async non-critical JavaScript
Some scripts block the page from becoming interactive because the browser stops to run them.
deferis usually best for your own scripts that can wait until HTML is parsed.asyncis better for independent scripts (often third-party) that don’t rely on other code.
If you’re not sure, start by deferring anything that isn’t required for the first screen (menus, animations, sliders, tracking extras).
Limit heavy libraries and large frameworks where possible
Big libraries can add hundreds of KB (or more). Before adding another plugin or framework, ask:
- Can the feature be done with simpler code?
- Can you remove a library that’s only used on one page?
Fewer scripts usually means fewer surprises—especially on mobile performance, where CPU time matters as much as download size.
Third-Party Scripts: Small Widgets, Big Slowdowns
Third-party scripts are anything your site loads from another company’s servers. They’re popular because they add features quickly—but they can also be some of the biggest, least predictable causes of slow page load time.
Common culprits (and why they hurt)
Most slowdowns come from a handful of categories:
- Analytics and tracking (Google Analytics, pixels, tag managers)
- Chat widgets (live chat, chatbots)
- Ads and retargeting (ad networks, header bidding)
- Embeds (YouTube videos, social posts, maps, review widgets)
These scripts often download extra files, run a lot of JavaScript, and sometimes block the browser from finishing the page.
How to spot “long tasks” and blocking scripts
Open Chrome DevTools → Performance, record a page load, and look for:
- Long tasks (big blocks on the main thread). These usually mean JavaScript is keeping the page from responding.
- Scripts that run early (before you can scroll or click) and delay rendering.
You can also run Lighthouse (Chrome DevTools → Lighthouse) and check recommendations related to “Reduce JavaScript execution time” and “Eliminate render-blocking resources.”
Make third-party scripts less harmful
A few beginner-friendly wins:
- Load after interaction when possible: don’t initialize chat, reviews, or video embeds until the user clicks, scrolls, or opens a panel.
- Delay non-essential tags: if a script isn’t needed for the first view, don’t run it during the critical loading moment.
Replace heavy embeds with lightweight previews
Instead of loading a full YouTube/Facebook/Map embed on page load, show a simple preview (thumbnail + play button). Only load the real embed when the user clicks.
This keeps the page fast for everyone—especially on mobile—without removing the feature entirely.
Hosting and Server Performance: TTFB in Plain English
TTFB (Time to First Byte) is the time it takes your server to start responding after a browser asks for a page. Think of it as “how long until the kitchen even starts cooking,” not how long until the full meal is served.
A great-looking site can still feel slow if TTFB is high—especially on mobile networks where every delay is more noticeable.
What typically makes TTFB slow
TTFB is mostly about server-side work happening before anything is sent back:
- Server processing time: your site’s code has to run, build the page, and assemble the response.
- Database delays: each query (especially many small ones) adds time.
- Cache misses: if nothing is cached, the server has to do the “full build” for every request.
Even if your images and scripts are optimized, a slow server response can keep the browser waiting with a blank screen.
The easiest win: server-side caching for dynamic pages
If your site is built with a CMS or generates pages dynamically, server-side caching is often the biggest TTFB improvement. Instead of rebuilding the same page for every visitor, the server can store a ready-to-serve version.
Practical examples:
- Cache blog posts and marketing pages that don’t change every minute.
- Use page caching or “full-page cache” where your platform supports it.
- If you run a store or membership site, cache what you can (category pages, logged-out pages), and be selective for personalized pages.
Don’t forget compression (Brotli/Gzip)
Enable Brotli (preferred) or Gzip compression for text-based files like HTML, CSS, and JavaScript. This reduces how much data has to travel over the network, which can improve perceived speed—especially for repeat page loads and mobile users.
When to upgrade hosting
Better hosting can absolutely reduce TTFB, but it’s smartest to fix obvious front-end issues first (huge images, too many third-party scripts, heavy JavaScript). If the browser is downloading megabytes of stuff, faster hosting won’t make the page feel truly fast.
Once you’ve handled the basics, upgrading hosting (more CPU/RAM, tuned database, better runtime performance) can be the final step that makes your site consistently snappy.
If you’re building a new product and want fewer hosting variables from day one, consider using a managed platform that bakes in sensible defaults. For example, Koder.ai hosts apps on AWS globally and supports deployments, custom domains, and environment rollbacks—useful when you’re testing performance changes across regions or need to comply with data residency requirements.
A Practical 1-Week Speed Plan for Beginners
You don’t need a huge project plan to improve website speed. You need a simple order of operations, a way to confirm you didn’t accidentally make things worse, and a bias toward fixes that reliably reduce page load time.
The 1-week order: measure → images → caching → trim JavaScript
Day 1: Measure (before you touch anything).
Pick 2–3 important pages (homepage, a key landing page, a popular blog post/product page). Run:
- PageSpeed Insights (focus on Core Web Vitals)
- Chrome DevTools Lighthouse
Write down your baseline for mobile performance and desktop. If you can, also test on a real phone (even your own) over cellular—this often reveals problems lab tests hide.
Days 2–3: Fix images (fastest, most reliable win).
Prioritize:
- Compress large images and serve modern formats where possible (WebP/AVIF)
- Resize images to the maximum size they’re actually displayed
- Make sure the main “hero” image loads quickly (it’s often the first thing users notice)
Re-test after you update just a few images so you can see the effect.
Days 4–5: Fix caching (make repeat visits much faster).
Enable basic browser caching and server/page caching where appropriate. The goal is simple: don’t regenerate or re-download the same assets on every visit. After enabling caching, verify that returning to the page feels noticeably quicker.
Days 6–7: Trim JavaScript (often the biggest long-term gain).
Look for:
- Unused plugins/features (remove them rather than “optimize” them)
- Heavy sliders/animations that don’t help conversions
- Extra tracking tags you no longer need
Small changes here can dramatically improve interactivity and Core Web Vitals, especially on mobile.
Simple regression checks after each change
After every major edit (images, caching, scripts), do three quick checks:
- Run the same tests again on the same pages and compare numbers to your Day 1 baseline.
- Click through the site like a visitor (forms, checkout, menus). Speed wins aren’t worth breaking usability.
- Check mobile-first: if it’s only fast on desktop, it’s not truly fast.
When to get help
If you’ve optimized images and caching and you still see persistent high TTFB, it usually points to hosting/server setup, a slow database, or heavy backend work. Also consider help if your site is a complex app (membership sites, marketplaces, lots of personalization) where “just cache it” isn’t straightforward.
If you want a deeper guide on server response time, see /blog/ttfb-explained.
FAQ
What does “website speed” actually mean for a visitor?
Website speed usually means two things:
- How fast the page shows meaningful content (so you’re not staring at a blank screen).
- How fast it becomes responsive (clicks, taps, and scrolling don’t lag).
A page can “look loaded” but still feel slow if JavaScript is busy or the layout is shifting.
Which speed metrics matter most for beginners (LCP, INP, CLS)?
Core Web Vitals map to common user complaints:
- LCP: when the main content (often a hero image or headline block) appears.
- INP: how quickly the page responds after a click/tap/type.
- CLS: how much the layout jumps during load.
Improving these usually improves real perceived speed, not just a score.
What are “good” target numbers for Core Web Vitals and TTFB?
Use these as practical targets:
- LCP: ≤ 2.5s (up to 4.0s needs work)
- INP: ≤ 200ms (up to 500ms needs work)
- CLS: ≤ 0.10 (above 0.25 is a problem)
- TTFB: ≤ 0.8s (above 1.8s often feels slow)
Treat them as directional goals—focus on moving the worst metric first.
How should I measure my site speed before making changes?
Start with a baseline so you don’t guess:
- Run PageSpeed Insights (check mobile first; note field vs lab data).
- Run Lighthouse 2–3 times and keep the middle result.
- Use WebPageTest for the waterfall to see what’s blocking.
Record device, network, location, exact URL, and only change 1–2 things before re-testing.
What are the most common reasons a page loads slowly?
The biggest causes are usually:
- Oversized/uncompressed images
- Too much JavaScript/CSS, especially from plugins and themes
- Third-party scripts (chat, popups, embeds, tracking)
- Slow server response (TTFB) from hosting, uncached pages, or heavy backend work
Fixing these in that order tends to produce the fastest wins.
Why are images usually the fastest performance win?
Because they’re often the largest files on the page, and they affect both download time and LCP. Focus on four basics:
- Resize to the maximum displayed size (don’t upload 4000px for an 800px slot).
- Serve WebP/AVIF when possible.
- Compress aggressively until quality noticeably drops, then back off.
- Use responsive images (
srcset) so mobile gets smaller files.
These changes are usually low-risk and immediately measurable.
When should I use lazy loading, and what should I never lazy-load?
Lazy loading helps for content below the fold, but it can hurt LCP if misused.
Practical rules:
- Do lazy-load images/iframes that are off-screen on initial load.
- Don’t lazy-load your hero / largest above-the-fold image.
- Prevent CLS by reserving space with
width/heightor a fixed aspect ratio.
If something is critical to the first screen, consider preloading it sparingly.
How does caching speed up a site, and what should I cache?
Caching mainly speeds up repeat views (second page click, return visits):
- Set longer caching for static assets (images, CSS, JS, fonts).
- Cache HTML carefully (often shorter) since content changes.
- Use versioned filenames (e.g.,
app.3f2a1c.js) so long caching doesn’t trap users on old files.
Done right, caching reduces re-downloads and server work without breaking updates.
Do I need a CDN, and when will it actually help?
A CDN helps most when you have visitors spread across regions and you serve lots of static files.
It’s best for:
- Images, CSS, JavaScript, fonts (cacheable assets)
Watch for:
- Misconfigured cache headers (no caching)
- Stale content (use cache-busting filenames and the CDN purge feature)
A CDN won’t fix heavy pages by itself—optimize images/scripts first, then add a CDN as a multiplier.
What’s a practical 1-week plan to improve website speed without breaking things?
Use a simple sequence you can finish and verify:
- Day 1: Measure 2–3 key pages and record baselines.
- Days 2–3: Fix images (resize, compress, modern formats, responsive sizes).
- Days 4–5: Enable browser + server/page caching.
- Days 6–7: Trim JavaScript and third-party scripts (remove what you don’t need; defer non-critical).
After each step, re-test under the same conditions and click through the site to ensure nothing broke.