Nov 26, 2025·8 min
Why Graph Databases Excel at Relationships—Not Everything
Graph databases shine when connections drive your questions. Learn the best use cases, trade-offs, and when relational or document databases are a better fit.
Graph databases shine when connections drive your questions. Learn the best use cases, trade-offs, and when relational or document databases are a better fit.
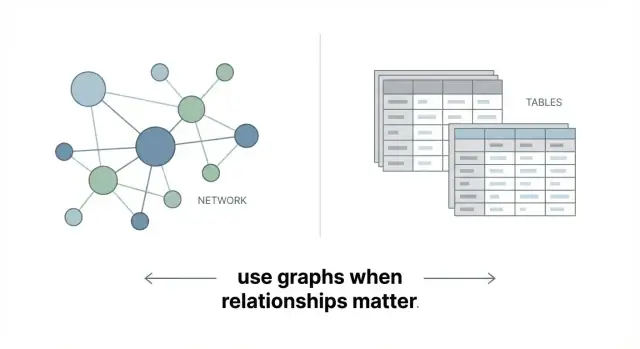
A graph database stores data as a network instead of a set of tables. The core idea is simple:
That’s it: a graph database is built to represent connected data directly.
In a graph database, relationships aren’t an afterthought—they’re stored as real, queryable objects. A relationship can have its own properties (for example, a PURCHASED relationship can store date, channel, and discount), and you can traverse from one node to the next efficiently.
This matters because many business questions are naturally about paths and connections: “Who is connected to whom?”, “How many steps away is this entity?”, or “What are the common links between these two things?”
Relational databases excel at structured records: customers, orders, invoices. Relationships exist there too, but they’re usually represented indirectly via foreign keys, and connecting multiple hops often means writing joins across several tables.
Graphs keep the connections right next to the data, so exploring multi-step relationships tends to be more straightforward to model and query.
Graph databases are excellent when the relationships are the main point—recommendations, fraud rings, dependency mapping, knowledge graphs. They’re not automatically better for simple reporting, totals, or highly tabular workloads. The goal isn’t to replace every database, but to use graph where connectivity drives the value.
Most business questions aren’t really about single records—they’re about how things connect.
A customer isn’t just a row; they’re linked to orders, devices, addresses, support tickets, referrals, and sometimes other customers. A transaction isn’t just an event; it’s connected to a merchant, a payment method, a location, a time window, and a chain of related activity. When the question is “who/what is connected to what, and how?”, relationship data becomes the main character.
Graph databases are designed for traversals: you start at one node and “walk” the network by following edges.
Instead of joining tables repeatedly, you express the path you care about: Customer → Device → Login → IP Address → Other Customers. That step-by-step framing matches how people naturally investigate fraud, trace dependencies, or explain recommendations.
The real difference shows up when you need multiple hops (two, three, five steps away) and you don’t know in advance where the interesting connections will appear.
In a relational model, multi-hop questions often turn into long chains of joins plus extra logic to avoid duplicates and control path length. In a graph, “find me all paths up to N hops” is a normal, readable pattern—especially in the property graph model used by many graph databases.
Edges aren’t just lines; they can carry data:
Those properties let you ask better questions: “connected within the last 30 days,” “strongest ties,” or “paths that include high-risk transactions”—without forcing everything into separate lookup tables.
Graph databases shine when your questions depend on connectedness: “who is linked to whom, through what, and how many steps away?” If the value of your data lives in relationship data (not just rows of attributes), a graph model can make both data modeling and querying feel more natural.
Anything shaped like a network—friends, followers, coworkers, teams, referrals—maps cleanly to nodes and relationships. Typical questions include “mutual connections,” “shortest path to a person,” or “who connects these two groups?” These queries often become awkward (or slow) when forced into many join tables.
Recommendation engines often depend on multi-step connections: user → item → category → similar items → other users. Graph databases are well-suited for “people who liked X also liked Y,” “items frequently co-viewed,” and “find me products connected by shared attributes or behavior.” This is especially useful when signals are diverse and you keep adding new relationship types.
Fraud detection graphs work well because suspicious behavior is rarely isolated. Accounts, devices, transactions, phone numbers, emails, and addresses form webs of shared identifiers. A graph makes it easier to spot rings, repeated patterns, and indirect links (e.g., two “unrelated” accounts using the same device through a chain of activity).
For services, hosts, APIs, calls, and ownership, the primary question is dependency: “what breaks if this changes?” Graphs support impact analysis, root-cause exploration, and “blast radius” queries when systems are interconnected.
Knowledge graphs connect entities (people, companies, products, documents) to facts and references. This helps with search, entity resolution, and tracing “why” a fact is known (provenance) across many linked sources.
Graph databases shine when the question is really about connections: who is linked to whom, through what chain, and with which patterns repeating. Instead of joining tables again and again, you ask the relationship question directly and keep the query readable as the network grows.
Typical questions:
This is useful for customer support (“why did we suggest this?”), compliance (“show the chain of ownership”), and investigations (“how did this spread?”).
Graphs help you spot natural groupings:
You can use this to segment users, find fraud crews, or understand how products are co-purchased. The key is that the “group” is defined by how things connect, not by a single column.
Sometimes the question isn’t just “who is connected,” but “who matters most” in the web:
These central nodes often point to influencers, critical infrastructure, or bottlenecks worth monitoring.
Graphs are great at searching for repeatable shapes:
In Cypher (a common graph query language), a triangle pattern can look like:
MATCH (a)-[:KNOWS]->(b)-[:KNOWS]->(c)-[:KNOWS]->(a)
RETURN a,b,c
Even if you never write Cypher yourself, this illustrates why graphs are approachable: the query mirrors the picture in your head.
Relational databases are great at what they were built for: transactions and well-structured records. If your data fits neatly into tables (customers, orders, invoices) and you mostly retrieve it by IDs, filters, and aggregates, relational systems are often the simplest, safest choice.
Joins are fine when they’re occasional and shallow. The friction starts when your most important questions require many joins, all the time, across multiple tables.
Examples:
In SQL, these can turn into long queries with repeated self-joins and complex logic. They can also become harder to tune as relationship depth grows.
Graph databases store relationships explicitly, so multi-step traversals across connections are a natural operation. Instead of stitching tables together at query time, you traverse connected nodes and edges.
That often means:
If your team frequently asks multi-hop questions—“connected to,” “through,” “in the same network as,” “within N steps”—a graph database is worth considering.
If your core workload is high-volume transactions, strict schemas, reporting, and straightforward joins, relational is usually the better default. Many real systems use both; see /blog/practical-architecture-graph-alongside-other-databases.
Graph databases shine when relationships are the “main event.” If your app’s value doesn’t depend on traversing connections (who-knows-who, how items relate, paths, neighborhoods), a graph can add complexity without much payoff.
If most requests are “get user by ID,” “update profile,” “create order,” and the data you need lives in one record (or a predictable, small set of tables), a graph database is often unnecessary. You’ll spend time modeling nodes and edges, tuning traversals, and learning a new query style—while a relational database handles this pattern efficiently and with familiar tooling.
Dashboards built on totals, averages, and grouped metrics (revenue by month, orders by region, conversion rate by channel) typically fit SQL and columnar analytics better than graph queries. Graph engines can answer some aggregate questions, but they’re rarely the easiest or fastest path for heavy OLAP-style workloads.
When you rely on mature SQL features—complex joins with strict constraints, advanced indexing strategies, stored procedures, or well-established ACID transaction patterns—relational systems are often the natural fit. Many graph databases support transactions, but the surrounding ecosystem and operational patterns may not match what your team already depends on.
If your data is largely a set of independent entities (tickets, invoices, sensor readings) with minimal cross-linking, a graph model can feel forced. In these cases, focus on a clean relational schema (or document model) and only consider graph later if relationship-heavy questions become central.
A good rule: if you can describe your top queries without words like “connected,” “path,” “neighborhood,” or “recommend,” a graph database may be the wrong first choice.
Graph databases shine when you need to follow connections quickly—but that strength has a price. Before you commit, it helps to understand where graphs tend to be less efficient, more expensive, or simply different to run day to day.
Graph databases often store and index relationships in a way that makes “hops” fast (e.g., from a customer to their devices to their transactions). The trade-off is that they can cost more in memory and storage than a comparable relational setup, especially once you add indexes for common lookups and keep relationship data readily accessible.
If your workload looks like a spreadsheet—large table-like scans, reporting queries over millions of rows, or heavy aggregation (totals, averages, grouped rollups)—a graph database may be slower or more expensive for the same result. Graphs are optimized for traversals (“who is connected to what?”), not for crunching big batches of independent records.
Operational complexity can be a real factor. Backups, scaling, and monitoring are different from what many teams are used to with relational systems. Some graph platforms scale best by scaling up (bigger machines), while others support scaling out but require careful planning around consistency, replication, and query patterns.
Your team may need time to learn new modeling patterns and query approaches (for example, the property graph model and languages like Cypher). The learning curve is manageable, but it’s still a cost—especially if you’re replacing mature SQL-based reporting workflows.
A practical approach is to use graph where relationships are the product, and keep existing systems for reporting, aggregation, and tabular analytics.
A useful way to think about graph modeling is simple: nodes are things, and edges are relationships between things. People, accounts, devices, orders, products, locations—those are nodes. “Bought,” “logged in from,” “works with,” “is parent of”—those are edges.
Most product-focused graph databases use the property graph model: both nodes and edges can have properties (key–value fields). For example, an edge PURCHASED might store date, amount, and channel. This makes it natural to model “relationships with details.”
RDF represents knowledge as triples: subject – predicate – object. It’s great for interoperable vocabularies and linking data across systems, but it often shifts “relationship details” into additional nodes/triples. Practically, you’ll notice RDF pushes you toward standard ontologies and SPARQL patterns, while property graphs feel closer to application data modeling.
You don’t need to memorize syntax early—what matters is that graph queries are usually expressed as paths and patterns, not as joining tables.
Graphs are often schema-flexible, meaning you can add a new node label or property without a heavy migration. But flexibility still needs discipline: define naming conventions, required properties (e.g., id), and rules for relationship types.
Pick relationship types that explain meaning (“FRIEND_OF” vs “CONNECTED”). Use direction to clarify semantics (e.g., FOLLOWS from follower to creator), and add edge properties when the relationship has its own facts (time, confidence, role, weight).
A problem is “relationship-driven” when the hard part isn’t storing records—it’s understanding how things connect, and how those connections change meaning depending on the path you take.
Begin by writing your top 5–10 questions in plain language—the ones stakeholders keep asking and your current system answers slowly or inconsistently. Good graph candidates usually include phrases like “connected to,” “through,” “similar to,” “within N steps,” or “who else.”
Examples:
Once you have questions, map the nouns and verbs:
Then decide what must be a relationship versus a node. A practical rule: if something needs its own attributes and you’ll connect multiple parties to it, make it a node (for example, an “Order” or “Login event” can be a node when it carries detail and connects many entities).
Add properties that let you narrow results and rank relevance without extra joins or post-processing. Typical high-value properties include time, amount, status, channel, and confidence score.
If most of your important questions require multi-step connections plus filtering by those properties, you’re likely dealing with a relationship-driven problem where graph databases shine.
Most teams don’t replace everything with a graph database. A more practical approach is to keep your “system of record” where it already works well (often SQL), and use a graph database as a specialized engine for relationship-heavy questions.
Use your relational database for transactions, constraints, and canonical entities (customers, orders, accounts). Then project a relationship view into a graph database—only the nodes and edges you need for connected queries.
This keeps auditing and data governance straightforward while still unlocking fast traversal queries.
A graph database shines when you attach it to a clearly scoped feature, such as:
Start with one feature, one team, and one measurable outcome. You can expand later if it proves value.
If your bottleneck is shipping the prototype (not debating the model), a vibe-coding platform like Koder.ai can help you stand up a simple graph-powered app quickly: you describe the feature in chat, generate a React UI and Go/PostgreSQL backend, and iterate while your data team validates the graph schema and queries.
How fresh does the graph need to be?
A common pattern is: write transactions to SQL → publish change events → update the graph.
Graphs get messy when IDs drift.
Define stable identifiers (e.g., customer_id, account_id) that match across systems, and document who “owns” each field and relationship. If two systems can create the same edge (say, “knows”), decide which one wins.
If you’re planning a pilot, see /blog/getting-started-a-low-risk-pilot-plan for a staged rollout approach.
A graph pilot should feel like an experiment, not a rewrite. The goal is to prove (or disprove) that relationship-heavy queries become simpler and faster—without betting the whole data stack.
Start with a narrow dataset that already causes pain: too many JOINs, brittle SQL, or slow “who is connected to what?” questions. Keep it limited to one workflow (for example: customer ↔ account ↔ device, or user ↔ product ↔ interaction) and define a handful of queries you want answered end-to-end.
Measure more than speed:
If you can’t name the “before” numbers, you won’t trust the “after.”
It’s tempting to model everything as nodes and edges. Resist that. Watch for “graph sprawl”: too many node/edge types without a clear query that needs them. Every new label or relationship should earn its place by enabling a real question.
Plan for privacy, access control, and data retention early. Relationship data can reveal more than individual records (for example, connections that imply behavior). Define who can query what, how results are audited, and how data is deleted when required.
Use a simple sync (batch or streaming) to feed the graph while your existing system stays the source of truth. When the pilot proves value, you can expand scope—carefully, one use case at a time.
If you’re choosing a database, don’t start with the technology—start with the questions you need to answer. Graph databases shine when your hardest problems are about connections and paths, not just storing records.
Use this checklist to sanity-check fit before you invest:
If you answered “yes” to most of these, a graph can be a strong fit—especially when you need multi-hop pattern matching like:
If your work is mostly simple lookups (by ID/email) or aggregations (“total sales by month”), a relational database or a key-value/document store is usually simpler and cheaper to run.
Write down your top 10 business questions as plain sentences, then test them on real data in a small pilot. Time the queries, note what’s hard to express, and keep a short log of model changes you needed. If your pilot mostly turns into “more joins” or “more caching,” that’s a signal a graph may pay off. If it’s mostly counts and filters, it likely won’t.
A graph database stores data as nodes (entities) and relationships (connections) with properties on both. It’s optimized for questions like “how is A connected to B?” and “who is within N steps?” rather than primarily for tabular reporting.
Because relationships are stored as real, queryable objects (not just foreign-key values). You can traverse multiple hops efficiently and attach properties to the relationship itself (e.g., date, amount, risk_score), which makes connection-heavy questions easier to model and query.
Relational databases represent relationships indirectly (foreign keys) and often require multiple JOINs for multi-hop questions. Graph databases keep connections adjacent to the data, so variable-depth traversals (like 2–6 hops) are typically more direct to express and maintain.
Use a graph database when your core questions involve paths, neighborhoods, and patterns:
Common graph-friendly queries include:
Often when your workload is mostly:
In those cases, a relational or analytics system is usually simpler and cheaper.
Model a relationship as an edge when it primarily connects two entities and may carry its own properties (time, role, weight). Model it as a node when it’s an event or entity with multiple attributes that connects to many parties (e.g., an Order or Login event linked to user, device, IP, and time).
Typical trade-offs include:
Property graphs let nodes and relationships have properties (key–value fields) and are common for application-style modeling. RDF represents knowledge as triples (subject–predicate–object) and often aligns with shared vocabularies and SPARQL.
Pick based on whether you need app-centric relationship properties (property graph) or interoperable semantic modeling (RDF).
Keep your existing system (often SQL) as the source of truth, then project the relationship view into a graph for one scoped feature (recommendations, fraud, identity resolution). Sync via batch or streaming, use stable identifiers across systems, and measure success (latency, query complexity, developer time) before expanding. See /blog/practical-architecture-graph-alongside-other-databases and /blog/getting-started-a-low-risk-pilot-plan.