May 14, 2025·8 min
Why OLTP and OLAP Workloads Rarely Belong in One Database
Learn why mixing transactional (OLTP) and analytics (OLAP) on one database can slow apps, raise costs, and complicate operations—and what to do instead.
Learn why mixing transactional (OLTP) and analytics (OLAP) on one database can slow apps, raise costs, and complicate operations—and what to do instead.
When people say “OLTP” and “OLAP,” they’re talking about two very different ways a database gets used.
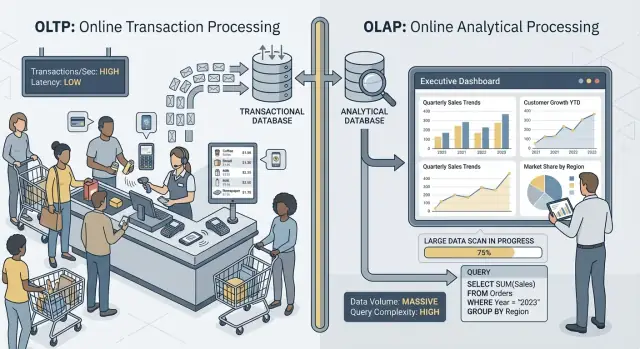
OLTP (Online Transaction Processing) is the workload behind day-to-day actions that must be fast and correct every time. Think: “save this change right now.”
Typical OLTP tasks include creating an order, updating inventory, recording a payment, or changing a customer address. These operations are usually small (a few rows), frequent, and must respond in milliseconds because a person or another system is waiting.
OLAP (Online Analytical Processing) is the workload used to understand what happened and why. Think: “scan a lot of data and summarize it.”
Typical OLAP tasks include dashboards, trend reports, cohort analysis, forecasting, and “slice-and-dice” questions like: “How did revenue change by region and product category over the last 18 months?” These queries often read many rows, perform heavy aggregations, and can run for seconds (or minutes) without being “wrong.”
The main idea is simple: OLTP optimizes for fast, consistent writes and small reads, while OLAP optimizes for large reads and complex calculations. Because the goals differ, the best database settings, indexes, storage layout, and scaling approach often differ too.
Also note the wording: rarely, not never. Some small teams can share one database for a while, especially with modest data volume and careful query discipline. Later sections cover what breaks first, common separation patterns, and how to move reporting off production safely.
OLTP and OLAP may both “use SQL,” but they’re optimized for different jobs—and that shows up in what each one considers success.
OLTP (transactional) systems power day-to-day operations: checkout flows, account updates, reservations, support tools. The priorities are straightforward:
Success is often tracked with latency metrics like p95/p99 request time, error rate, and how well the system behaves under peak concurrency.
OLAP (analytics) systems answer questions like “What changed this quarter?” or “Which segment churned after the new pricing?” These queries often:
Success here looks more like query throughput, time-to-insight, and the ability to run complex queries without hand-tuning every report.
When you force both workloads into one database, you’re asking it to be simultaneously great at tiny, high-volume transactions and at big, exploratory scans. The result is usually compromise: OLTP gets unpredictable latency, OLAP gets throttled to protect production, and teams end up arguing over whose queries are “allowed.” Separate goals deserve separate success metrics—and usually separate systems.
When OLTP (your app’s day-to-day transactions) and OLAP (reporting and analysis) run on the same database, they fight over the same finite resources. The result isn’t just “slower reporting.” It’s often slower checkouts, stalled logins, and unpredictable app hiccups.
Analytical queries tend to be long-running and heavy: joins across large tables, aggregations, sorting, and grouping. They can monopolize CPU cores and, just as importantly, memory for hash joins and sort buffers.
Meanwhile, transactional queries are usually small but latency-sensitive. If CPU is saturated or memory pressure forces frequent eviction, those tiny queries start waiting behind the big ones—even if each transaction only needs a few milliseconds of actual work.
Analytics often triggers large table scans and reads lots of pages sequentially. OLTP workloads do the opposite: many small, random reads plus constant writes to indexes and logs.
Put them together and the database storage subsystem has to juggle incompatible access patterns. Caches that were helping OLTP can get “washed out” by analytics scans, and write latency can spike when the disk is busy streaming data for reports.
A few analysts running broad queries can tie up connections for minutes. If your application uses a fixed-size pool, requests queue up waiting for a free connection. That queueing effect can make a healthy system feel broken: average latency might look acceptable, but tail latencies (p95/p99) become painful.
From the outside, this shows up as timeouts, slow checkout flows, delayed search results, and generally flaky behavior—often “only during reporting” or “only at the end of the month.” The app team sees errors; the analytics team sees slow queries; the real issue is shared contention underneath.
OLTP and OLAP don’t just “use the database differently”—they reward opposite physical designs. When you try to satisfy both in one place, you usually end up with a compromise that’s expensive and still underperforms.
Transactional workload is dominated by short queries that touch a tiny slice of data: fetch one order, update one inventory row, list the last 20 events for a single user.
That pushes OLTP schemas toward row-oriented storage and indexes that support point lookups and small range scans (often on primary keys, foreign keys, and a few high-value secondary indexes). The goal is predictable, low latency—especially for writes.
Analytics workload often needs to read a lot of rows and only a few columns: “revenue by week by region,” “conversion rate by campaign,” “top products by margin.”
OLAP systems benefit from columnar storage (to read only the columns needed), partitioning (to prune old or irrelevant data quickly), and pre-aggregation (materialized views, rollups, summary tables) so reports don’t repeatedly recompute the same totals.
A common reaction is to add indexes until every dashboard is fast. But every extra index increases write cost: inserts, updates, and deletes now have more structures to maintain. It also increases storage and can slow maintenance tasks like vacuuming, reindexing, and backups.
Databases choose query plans based on statistics—estimates of how many rows match a filter, how selective an index is, and how data is distributed. OLTP changes data constantly. As distributions shift, statistics can drift, and the planner may pick a plan that’s great for yesterday’s data but slow today.
Mix in heavy OLAP queries that scan and join large tables, and you get more variability: the “best plan” becomes harder to predict, and tuning for one workload often makes the other worse.
Even if your database “supports concurrency,” mixing heavy reporting with live transactions creates subtle slowdowns that are hard to predict—and even harder to explain to a customer staring at a spinning checkout.
OLAP-style queries often scan lots of rows, join multiple tables, and run for seconds or minutes. During that time they can hold locks (for example on schema objects, or when they need to sort/aggregate into temp structures) and they frequently increase lock contention indirectly by keeping many rows “in play.”
Even with MVCC (multi-version concurrency control), the database must track multiple versions of the same row so readers and writers don’t block each other. That helps, but it doesn’t eliminate contention—especially when queries touch hot tables that transactions update constantly.
MVCC means old row versions stick around until the database can safely remove them. A long-running report can keep an old snapshot open, which prevents cleanup from reclaiming space.
That affects:
The result is a double hit: reporting makes the database work harder and makes the system slower over time.
Reporting tools often request stronger isolation (or accidentally run in a long transaction). Higher isolation can increase waiting on locks and increase the amount of versioning the engine must manage. From the OLTP side, you see this as unpredictable spikes: most orders write fast, then a few suddenly stall.
At month-end, finance runs a “revenue by product” query that scans orders and line items for the entire month. While it runs, new order writes are still accepted, but vacuum can’t reclaim old versions and indexes churn. The order API starts seeing occasional timeouts—not because it’s “down,” but because contention and cleanup overhead quietly push latency over your limits.
OLTP systems live and die by predictability. A checkout, support ticket, or balance update isn’t “mostly fine” if it’s fast 95% of the time—users notice the slow moments. OLAP, by contrast, is often bursty: a few heavy queries can be quiet for hours and then suddenly consume a lot of CPU, memory, and I/O.
Analytics traffic tends to bunch up around routines:
Meanwhile, OLTP traffic is usually steadier (or at least more continuous). When both workloads share one database, those analytics spikes translate into unpredictable latency for transactions—timeouts, slower page loads, and occasional retries that add even more load.
You can reduce damage with tactics like running reports at night, limiting concurrency, enforcing statement timeouts, or setting query cost caps. These are valuable guardrails, especially for “reporting on production.”
But they don’t remove the fundamental tension: OLAP queries are designed to use lots of resources to answer big questions, while OLTP needs small, quick resource slices all day. The moment an unexpected dashboard refresh, ad-hoc query, or backfilled report slips through, the shared database is exposed again.
On shared infrastructure, one “noisy” analytics user or job can monopolize cache, saturate disk, or pressure CPU scheduling—without doing anything wrong. The OLTP workload becomes collateral damage, and the hardest part is that the failures look random: latency spikes instead of clear, repeatable errors.
Mixing OLTP (transactions) and OLAP (analytics) doesn’t just create performance headaches—it also makes day-to-day operations harder. The database becomes a single “everything box,” and every operational task inherits the combined risks of both workloads.
Analytics tables tend to grow wide and fast (more history, more columns, more aggregates). That extra volume changes your recovery story.
A full backup takes longer, consumes more storage, and increases the chance you’ll miss your backup window. Restores are worse: when you need to recover quickly, you’re restoring not only the transactional data your app needs, but also large analytical datasets that aren’t required to get the business running again. Disaster recovery tests also take longer, so they happen less often—exactly the opposite of what you want.
Transactional growth is usually predictable: more customers, more orders, more rows. Analytics growth is often lumpy: a new dashboard, a new retention policy, or one team deciding to keep “just one more year” of raw events.
When both live together, you can’t easily answer:
That uncertainty leads to overprovisioning (paying for headroom you don’t need) or underprovisioning (surprise outages).
In a shared database, one “innocent” query can become an incident. You’ll end up adding guardrails such as query timeouts, workload quotas, scheduled reporting windows, or workload management rules. These help, but they’re brittle: the app and analysts are now competing for the same limits, and policy changes for one group can break the other.
Applications typically need narrow, purpose-built permissions. Analysts often need broad read access, sometimes across many tables, to explore and validate. Putting both in one database increases pressure to grant wider privileges “just to make the report work,” raising the blast radius of mistakes and expanding the set of people who can see sensitive operational data.
Trying to run OLTP and OLAP in the same database often looks cheaper—until you start scaling. The problem isn’t just performance. It’s that the “right” way to scale each workload pushes you toward different infrastructure, and combining them forces expensive compromises.
Transactional systems are constrained by writes: many small updates, strict latency, and bursts that must be absorbed immediately. Scaling OLTP commonly means vertical scaling (bigger CPU, faster disks, more memory) because write-heavy workloads don’t fan out easily.
When vertical limits are reached, you’re looking at sharding or other write-scaling patterns. That adds engineering overhead and often requires careful changes to the application.
Analytics workloads scale differently: long scans, heavy aggregations, and lots of read throughput. OLAP systems typically scale by adding distributed compute, and many modern setups separate compute from storage so you can scale query horsepower without moving or duplicating data.
If OLAP shares the OLTP database, you can’t scale analytics independently. You scale the whole database—even if transactions are fine.
To keep transactions fast while running reports, teams over-provision the production database: extra CPU headroom, high-end storage, and larger instances “just in case.” That means you’re paying OLTP prices to support OLAP behavior.
Separation reduces over-provisioning because each system can be sized to its job: OLTP for predictable low-latency writes, OLAP for bursty heavy reads. The result is often cheaper overall—even though it’s “two systems”—because you stop buying premium transactional capacity to run reporting on production.
Most teams separate transactional workload (OLTP) from analytics workload (OLAP) by adding a second “read-oriented” system rather than forcing one database to serve both.
A common first step is a read replica (or follower) of the OLTP database, where BI tools run queries.
Pros: minimal app changes, familiar SQL, quick to set up.
Cons: it’s still the same engine and schema, so heavy reports can saturate replica CPU/I/O; some reports require features not available on replicas; and replication lag means numbers may be minutes (or more) behind. Lag also creates confusing “why doesn’t it match production?” conversations during incidents.
Best fit: small teams, modest data volume, “near-real-time” is nice but not critical, and reporting queries are controlled.
Here, OLTP stays optimized for writes and point reads, while analytics goes to a data warehouse (or columnar analytics DB) designed for scans, compression, and large aggregations.
Pros: predictable OLTP performance, faster dashboards, better concurrency for analysts, and clearer cost/performance tuning.
Cons: you now operate another system and need a data model (often a star schema) that’s friendly for analytics.
Best fit: growing data, many stakeholders, complex reporting, or strict OLTP latency requirements.
Instead of periodic ETL, you stream changes using CDC (change data capture) from the OLTP log into the warehouse (often with ELT).
Pros: fresher data with less load on OLTP, easier incremental processing, and better auditability.
Cons: more moving parts and careful handling of schema changes.
Best fit: larger volumes, high freshness needs, and teams ready for data pipelines.
Moving data from your transactional database (OLTP) into an analytics system (OLAP) is less about “copying tables” and more about building a reliable, low-impact pipeline. The goal is simple: analytics gets what it needs, without putting production traffic at risk.
ETL (Extract, Transform, Load) means you clean and reshape data before it lands in the warehouse. This is useful when the warehouse is expensive to compute in, or you want tight control over what gets stored.
ELT (Extract, Load, Transform) loads raw-ish data first, then transforms inside the warehouse. This is often faster to set up and easier to evolve: you can keep the “source of truth” history and adjust transformations when requirements change.
A practical rule: if business logic changes frequently, ELT reduces rework; if governance requires only curated data stored, ETL may fit better.
Change Data Capture (CDC) streams inserts/updates/deletes from OLTP (often from the database log) into your analytics system. Instead of repeatedly scanning big tables, CDC lets you move only what changed.
What it enables:
Freshness is a business decision with a technical cost.
Define a clear SLA (for example: “data is up to 15 minutes behind”) so stakeholders know what “fresh” means.
Pipelines usually break quietly—until someone notices numbers are off. Add lightweight checks for:
These safeguards keep OLAP trustworthy while keeping OLTP protected.
Keeping OLTP and OLAP together isn’t automatically “wrong.” It can be a sensible temporary choice when the application is small, the reporting needs are narrow, and you can enforce hard boundaries so analytics can’t surprise your customers with slow checkouts, failed payments, or timeouts.
Small apps with light analytics and strict query limits often do fine on a single database—especially early on. The key is being honest about what “light” means: a handful of dashboards, modest row counts, and a clear ceiling on query runtime and concurrency.
For a narrow set of recurring reports, materialized views or summary tables can reduce the cost of analytics. Instead of scanning raw transactions, you precompute daily totals, top categories, or per-customer rollups. That keeps most queries short and predictable.
If business users can tolerate delayed numbers, off-peak reporting windows help. Schedule heavier jobs at night or during low-traffic periods, and consider a dedicated reporting role with tighter permissions and resource limits.
If you see rising transaction latency, recurring incidents during report runs, connection pool exhaustion, or “one query took down production” stories, you’re past the safe zone. At that point, separating databases (or at least using read replicas) stops being an optimization and becomes basic operational hygiene.
Moving analytics off the production database is less about a “big rewrite” and more about making the work visible, setting targets, and migrating in controlled steps.
Start with evidence, not assumptions. Pull a list of:
Include “hidden” analytics: ad-hoc SQL from BI tools, scheduled exports, and CSV downloads.
Write down the targets you’ll optimize for:
This prevents debates like “it’s slow” vs “it’s fine” and helps pick the right architecture.
Pick the simplest option that meets the targets:
Set up monitoring for replica lag/pipeline delays, dashboard runtimes, and warehouse spend. Add query budgets (timeouts, concurrency limits), and keep an incident playbook: what to do when freshness slips, loads spike, or key metrics diverge.
If you’re early in a product and moving fast, the biggest risk is accidentally building analytics directly into the same database path as core transactions (for example, dashboard queries that quietly become “production-critical”). One way to avoid that is to design the separation up front—even if you start with a modest read replica—and bake it into your architecture checklist.
Platforms like Koder.ai can help here because you can prototype the OLTP side (React app + Go services + PostgreSQL) and sketch the reporting/warehouse boundary in planning mode before you ship. As the product grows, you can export source code, evolve the schema, and add CDC/ELT components without turning “reporting on production” into a permanent habit.
OLTP (Online Transaction Processing) handles day-to-day operations like creating orders, updating inventory, and recording payments. It prioritizes low latency, high concurrency, and correctness.
OLAP (Online Analytical Processing) answers business questions via large scans and aggregations (dashboards, trends, cohorts). It prioritizes throughput, flexible queries, and fast summarization over millisecond response times.
Because the workloads compete for the same resources:
The result is often unpredictable p95/p99 latency for core user actions.
Not usually. Adding indexes to make dashboards fast often backfires because:
For analytics, you often get better results from in an OLAP-oriented system.
MVCC helps readers and writers avoid blocking, but it doesn’t make mixed workloads “free.” Practical issues include:
So even without obvious blocking, heavy analytics can degrade performance over time.
You often see symptoms like:
If the system feels “randomly slow” during dashboard refreshes, that’s a classic mixed-workload smell.
A read replica is often the first step:
It’s a good bridge when data volume is modest and “minutes behind” is acceptable.
A warehouse is a better fit when you need:
It typically requires an analytics-friendly model (often star/snowflake) and a pipeline to load data.
CDC (Change Data Capture) streams inserts/updates/deletes from the OLTP database (often via its log) into analytics.
It helps because:
The trade-off is more moving parts and careful handling of schema changes and ordering.
Pick based on how often business logic changes and what you want to store:
A practical approach is to start ELT for speed, then add governance (tests, curated models) as critical metrics stabilize.
Yes—temporarily—if you keep analytics truly lightweight and add guardrails:
It stops being acceptable when reporting regularly causes latency spikes, pool exhaustion, or production incidents.