লো-লেটেন্সির জন্য Disruptor প্যাটার্ন: পূর্বানুমেয় রিয়েল-টাইম ডিজাইন
লো-লেটেন্সির জন্য Disruptor প্যাটার্ন শিখুন এবং কিউ, মেমোরি, ও আর্কিটেকচারের সিদ্ধান্ত নিয়ে কীভাবে রিয়েল-টাইম সিস্টেমে পূর্বানুমেয় রেসপন্স টাইম ডিজাইন করা যায় তা জানুন।
লো-লেটেন্সির জন্য Disruptor প্যাটার্ন: পূর্বানুমেয় রিয়েল-টাইম ডিজাইন | Koder.ai
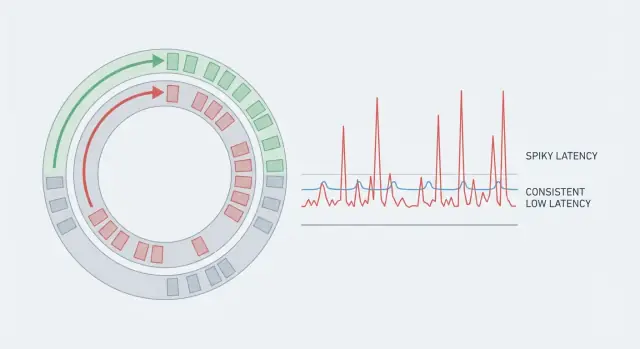
কেন রিয়েল-টাইম অ্যাপ ধীর মনে হয় যখন কোড দ্রুত\n\nগতির দুটি দিক আছে: throughput এবং latency। Throughput হলো প্রতি সেকেন্ডে আপনি কত কাজ শেষ করছেন (request, message, frame)। Latency হলো একটি একক কাজ শুরু থেকে শেষ হতে কত সময় নেয়।\n\nএকটা সিস্টেম ভাল throughput দিলেও ধীর লাগতে পারে যদি কিছু request অনেক বেশি সময় নেয়। এ কারণেই গড় মিথ্যার মতো। যদি 99টি অ্যাকশন 5 ms নেয় এবং একটি অ্যাকশন 80 ms নেয়, গড় ঠিক দেখায়, কিন্তু যে ব্যবহারকারীটা 80 ms পেয়েছে তিনি স্থবিরতা অনুভব করবেন। রিয়েল-টাইম সিস্টেমে এই বিরল স্পাইকগুলোই মূল গল্প, কারণ এগুলো রিদম ভেঙে দেয়।\n\nপূর্বানুমেয় latency মানে আপনি শুধুই নিম্ন গড়ের দিকে লক্ষ্য করছেন না—আপনি ধারাবাহিকতা চান, যাতে অধিকাংশ অপারেশন একটি ছোট রেঞ্জের মধ্যে শেষ হয়। এজন্য টিমগুলো tail (p95, p99) দেখেন। সেখানেই বিরতিগুলো লুকিয়ে থাকে।\n\n50 ms স্পাইক গুরুত্বপূর্ণ হতে পারে ভয়েস ও ভিডিও-তে (অডিও গ্লিচ), মাল্টিপ্লেয়ার গেমে (rubber-banding), রিয়েল-টাইম ট্রেডিং-এ (মিস হওয়া দাম), ইন্ডাস্ট্রিয়াল মনিটরিং-এ (বিলম্বিত অ্যালার্ম), এবং লাইভ ড্যাশবোর্ডে (নম্বর ঝাপসা, অ্যালার্ট অনির্ভরযোগ্য মনে হওয়া)।\n\nসাধারণ উদাহরণ: একটি চ্যাট অ্যাপ বেশিরভাগ সময়ে দ্রুত মেসেজ ডেলিভার করে। কিন্তু যদি ব্যাকগ্রাউন্ডে কোনো বিরতি একটি মেসেজ 60 ms দেরি করে পৌঁছে দেয়, টাইপিং নির্দেশক ফ্লিকার করে এবং কথোপকথন ল্যাগি মনে হয়—যদিও সার্ভার গড়ে “দ্রুত” দেখায়।\n\nরিয়েল-টাইম অনুভব করতে হলে আপনাকে বিস্ময় কম করতেই হবে, শুধু কোড দ্রুত করা যথেষ্ট নয়।\n\n## ল্যাটেন্সির মূল বিষয়: সময়টা আসলেই কোথায় যাচ্ছে\n\nঅধিকাংশ রিয়েল-টাইম সিস্টেম ধীর হয় না কারণ CPU ভুগছে। তারা ধীর অনুভব করে কারণ কাজের বেশিরভাগ সময়টি অপেক্ষায় যায়: শিডিউল হওয়ার অপেক্ষা, একটি কিউতে অপেক্ষা, নেটওয়ার্কের অপেক্ষা, বা স্টোরেজের অপেক্ষা।\n\nএন্ড-টু-এন্ড ল্যাটেন্সি হলো "কিছু হয়েছে" থেকে "ব্যবহারকারী ফলাফল দেখে" পর্যন্ত পুরো সময়। এমনকি যদি আপনার হ্যান্ডলার 2 ms এ চলে, request তবুও 80 ms নিতে পারে যদি সেটি পাঁচটি ভিন্ন জায়গায় আটকে যায়।\n\nপথ ভাঙার দরকারি উপায়টি হলো:\n\n- নেটওয়ার্ক সময় (ক্লায়েন্ট থেকে edge, সার্ভিস-টু-সার্ভিস, retries)\n- শিডিউলিং সময় (আপনার থ্রেড রান করার জন্য অপেক্ষা করে)\n- কিউ সময় (কাজ অন্যান্য কাজের পিছনে থাকে)\n- স্টোরেজ সময় (ডিস্ক, ডেটাবেস লক, ক্যাশ মিস)\n- সিরিয়ালাইজেশন সময় (ডেটা এনকোড/ডিকোড)\n\nএই অপেক্ষাগুলো জমে যায়। এখানে ওখানে কয়েক মিলিসেকেন্ড একটি “দ্রুত” কোড পাথকে ধীর অভিজ্ঞতায় পরিণত করে।\n\nTail latency হলো যেখানে ব্যবহারকারীরা অভিযোগ শুরু করে। গড় ল্যাটেন্সি ঠিক দেখাতে পারে, কিন্তু p95 বা p99 বলতে হচ্ছে সবচেয়ে ধীর 5% বা 1% request। আউটলায়ারগুলো সাধারণত বিরল বিরতিই—একটি GC সাইকেল, হোস্টে noisy neighbor, ছোট লক কনটেনশন, ক্যাশ রিফিল, বা একটি বর্ধিত burst যা কিউ তৈরি করে।\n\nকনক্রিট উদাহরণ: একটি প্রাইস আপডেট নেটওয়ার্কে 5 ms এ আসে, ব্যস্ত ওয়ার্কার জন্য 10 ms অপেক্ষা করে, অন্য ইভেন্টগুলোর পিছনে 15 ms থাকে, তারপর ডাটাবেস স্টলে 30 ms লক্ষ করে। আপনার কোডটি এখনও 2 ms এ চলেছে, কিন্তু ব্যবহারকারী অপেক্ষা করেছে 62 ms। লক্ষ্য হলো প্রতিটি ধাপকে পূর্বানুমেয় করা, শুধু গণনা দ্রুত করা নয়।\n\n## কোড গতির বাইরে যে সাধারণ জিটার উত্পন্ন হয়\n\nএকটি দ্রুত অ্যালগরিদমও ধীর লাগতে পারে যদি প্রতিটি অনুরোধের সময় ওঠানামা করে। ব্যবহারকারী স্পাইক লক্ষ্য করে, গড় নয়। এই ওঠানামাকে জিটার বলে, এবং প্রায়শই সেটা এমন জিনিস থেকেই আসে যা আপনার কোড পুরোপুরি নিয়ন্ত্রণ করে না।\n\nCPU ক্যাশ ও মেমোরি আচরণ লুকানো খরচ। যদি হট ডেটা ক্যাশে না ফিট করে, CPU RAM-এ অপেক্ষা করে থামে। অবজেক্ট-ভিত্তিক স্ট্রাকচার, ছড়িয়ে ছিটিয়ে মেমোরি, এবং “আরো একটা লুকআপ” প্রায়ই পুনরাবৃত্ত ক্যাশ মিসে পরিণত হয়।\n\nমেমোরি আলোকেশন নিজে একটি এলোমেলোতা যোগ করে। অনেক ক্ষণজীবী অবজেক্ট বরাদ্দ করলে heap-এ চাপ বাড়ে, যা পরে বিরতি (garbage collection) হিসেবে দেখা দেয় বা allocator contention তৈরি করে। GC না থাকলেও ফ্রিকোয়েন্ট আলোকেশনগুলি মেমোরি ভাঙচুর এবং লোকালিটি ক্ষতিগ্রস্ত করে।\n\nথ্রেড শিডিউলিং আরেকটি সাধারণ উৎস। যখন একটি থ্রেড deschedule হয়, আপনি context switch ওভারহেড পেয়েন এবং ক্যাশ ওয়ার্মথ হারান। একটি ব্যস্ত মেশিনে আপনার “রিয়েল-টাইম” থ্রেড অনান্য কাজে পিছিয়ে পড়তে পারে।\n\nলক কনটেনশনই সেই জায়গা যেখানে পূর্বানুমেয় সিস্টেম প্রায়ই ভেঙে যায়। একটি লক যা “সাধারণত খালি” মনে হয়, কনভয়ের দিকে যেতে পারে: থ্রেডগুলো ওঠে, লকের জন্য লড়ে, এবং আবার ঘুমিয়ে পড়ে। কাজ হবে, কিন্তু tail latency প্রসারিত হবে।\n\nI/O অপেক্ষা সবকিছুকে ছাপিয়ে যেতে পারে। একটি একক syscall, একটি পূর্ণ নেটওয়ার্ক বাফার, একটি TLS হ্যান্ডশেক, একটি ডিস্ক ফ্লাশ, বা ধীর DNS লুকআপ ধারালো স্পাইক তৈরি করতে পারে যাকে কোনো মাইক্রো-অপটিমাইজেশন ঠিক করতে পারবে না।\n\nযদি আপনি জিটার খোঁজেন, ক্যাশ মিস দেখুন (অবশ্যই pointer-heavy স্ট্রাকচার ও র্যান্ডম এক্সেস থেকে), ফ্রিকোয়েন্ট আলোকেশন, অতিরিক্ত থ্রেড বা noisy neighbor-র কারণে context switches, লক কনটেনশন, এবং যে কোনও blocking I/O (নেটওয়ার্ক, ডিস্ক, লগিং, synchronous কল)।\n\nউদাহরণ: একটি প্রাইস-টিকিং সার্ভিস মাইক্রোসেকেন্ডে আপডেট ধরে, কিন্তু একটি synchronized logger কল বা contended metrics lock মাঝে মাঝে দশক মিলিসেকেন্ড যোগ করতে পারে।\n\n## Martin Thompson এবং Disruptor প্যাটার্ন কি\n\nMartin Thompson লো-লেটেন্সি ইঞ্জিনিয়ারিং-এ পরিচিত কারণ তিনি চাপের মধ্যে সিস্টেম কেমন আচরণ করে সেই দিকে মনোযোগ দেন: কেবল গড় গতি নয়, পূর্বানুমেয় গতি। LMAX টিমের সাথে তিনি Disruptor প্যাটার্নকে পপুলার করেন—একটি রেফারেন্স পদ্ধতি ইভেন্টগুলো ধীরে ধীরে ও স্থিতিশীলভাবে সিস্টেম জুড়ে এগিয়ে নেওয়ার জন্য।\n\nDisruptor ধারণাটি এমন সমস্যার প্রতিক্রিয়া যেখানে অনেক “দ্রুত” অ্যাপ অনিয়মিত হয়: কনটেনশন ও সমন্বয়। প্রচলিত কিউগুলো প্রায়ই লক বা ভারি এটমিকসের উপর নির্ভর করে, থ্রেডকে জাগায় এবং স্তূপবদ্ধ অপেক্ষা তৈরি করে যখন প্রডিউসার ও কনজিউমার ভাগ করা স্ট্রাকচারের জন্য লড়াই করে।\n\nকিউয়ের বদলে Disruptor একটি ring buffer ব্যবহার করে: একটি নির্দিষ্ট আকারের সরকচক্রিক অ্যারে যা স্লটে ইভেন্ট রাখে। প্রডিউসাররা পরের স্লট ক্লেইম করে, ডেটা লেখে, তারপর একটি sequence নম্বর প্রকাশ করে। কনজিউমাররা সেই সিকোয়েন্স অনুসরণ করে অর্ডারে পড়ে। বাফার প্রি-অ্যালোকেটেড থাকায় বারবার আলোকেশন এড়ানো যায় এবং garbage collector-এ চাপ কমে।\n\nএকটি মূল ধারণা হলো single-writer principle: একটি নির্দিষ্ট শেয়ার্ড স্টেটের জন্য এক উপাদানই দায়িত্ব রাখবে (উদাহরণস্বরূপ রিংয়ের মাধ্যমে কৌরসর)। লেখক সংখ্যা কমলে “আগে কে?” ধরনের মুহূর্তও কমে।\n\nBackpressure স্পষ্ট। যখন কনজিউমার পিছিয়ে পড়ে, প্রডিউসাররা এমন একটি স্লটে পৌঁছায় যা এখনও ব্যবহৃত। তখন সিস্টেমকে অপেক্ষা, ড্রপ, বা ধীর করা উচিত—কিন্তু সেটি নিয়ন্ত্রিত ও দৃশ্যমানভাবে হয়, পাঁচ মিনিটের বর্ধিত কিউর মধ্যে গোপনীয়তার পরিবর্তে।\n\n## মূল ডিজাইন ধারণা যা ল্যাটেন্সি ধারাবাহিক রাখে\n\nDisruptor-স্টাইল ডিজাইনের দ্রুততা কোনো জটিল মাইক্রো-অপ্টিমাইজেশনের কারণে নয়। এটা অনিশ্চিত বিরতিগুলো দূর করা—যে বিরতিগুলো সিস্টেমকে নিজের চলমান অংশগুলোর বিরুদ্ধে লড়াই করায়: আলোকেশন, ক্যাশ মিস, লক কনটেনশন, এবং হট পাথে ধীর কাজ।\n\nএকটি কার্যকর মানসিক মডেল হলো অ্যাসেম্বলি লাইন। ইভেন্টগুলো নির্দিষ্ট রুট ধরে পরিষ্কার হ্যান্ডঅফ সহ চলে। সেটি শেয়ার্ড স্টেট কমায় এবং প্রতিটি ধাপকে সহজ ও পরিমাপযোগ্য রাখে।\n\n### মেমোরি ও ডেটা পূর্বানুমেয় রাখুন\n\nদ্রুত সিস্টেমগুলো আচমকা আলোকেশন এড়ায়। যদি আপনি বাফার প্রি-অ্যালোকেট করে মেসেজ অবজেক্ট রিইউজ করেন, আপনি GC, heap বৃদ্ধি এবং allocator locks থেকে হওয়া "কখনো কখনো" স্পাইক কমাবেন।\n\nএছাড়াও মেসেজগুলো ছোট ও স্থির রাখাটা সহায়ক। যখন প্রতিটি ইভেন্টে স্পর্শকৃত ডেটা CPU ক্যাশে ফিট করে, তখন আপনি মেমোরির জন্য অপেক্ষা কম পান।\n\nপ্রায়োগিক অভ্যাসগুলো যা সবচেয়ে গুরুত্বপূর্ণ: ইভেন্ট প্রতি নতুন অবজেক্ট তৈরির পরিবর্তে পুনঃব্যবহার করুন, ইভেন্ট ডেটা কুঞ্চিত রাখুন, শেয়ার্ড স্টেটের জন্য একক লেখককে অগ্রাধিকার দিন, এবং ব্যাচিং সাবধানে করুন যাতে সমন্বয় খরচ কমবার জন্য আপনি সেটি কম জায়গায় প্রদান করেন।\n\n### ধীর পথে স্পষ্টতা আনুন\n\nরিয়েল-টাইম অ্যাপগুলো প্রায়ই লগিং, মেট্রিকস, রিট্রাই, বা ডাটাবেস লেখার মতো অতিরিক্ত জিনিস চায়। Disruptor মানসিকতা হলো সেগুলোকে মূল লুপ থেকে আলাদা রাখা যাতে এগুলো ব্লক করতে না পারে।\n\nলাইভ প্রাইসিং ফিডে হট পাথটি কেবল একটি টিক যাচাই করে পরবর্তী প্রাইস স্ন্যাপশট প্রকাশ করতে পারে। কোন কিছুই যদি স্টল করতে পারে (ডিস্ক, নেটওয়ার্ক কল, ভারি সিরিয়ালাইজেশন) তাহলে সেটি আলাদা কনজিউমার বা(side channel) দিকে সরান, যাতে পূর্বানুমেয় পথ অটুট থাকে।\n\n## পূর্বানুমেয় ল্যাটেন্সির জন্য আর্কিটেকচার পছন্দসমূহ\n\nপূর্বানুমেয় ল্যাটেন্সি বেশিরভাগই একটি আর্কিটেকচার সমস্যা। আপনি দ্রুত কোড থাকতে পারেন এবং তবুও স্পাইক পাবেন যদি অনেক থ্রেড একই ডেটা নিয়ে লড়াই করে, বা মেসেজগুলো অকারণে নেটওয়ার্কে ঝাঁকুনি খায়।\n\nশুরু করুন সিদ্ধান্ত নিয়ে: কতজন লেখক এবং পাঠক একই কিউ বা বাফার স্পর্শ করবে। একক প্রডিউসার রাখা সহজে মসৃণ রাখা যায় কারণ এতে সমন্বয় প্রয়োজন কমে। মাল্টি-প্রডিউসার সেটআপ throughput বাড়াতে পারে, কিন্তু প্রায়ই কনটেনশন বাড়ায় এবং worst-case timing কম পূর্বানুমেয় করে। যদি আপনাকে বহু প্রডিউসার দরকার, তাহলে শেয়ার্ড লেখাগুলি কমানোর জন্য ইভেন্টগুলোকে কী (userId বা instrumentId) অনুযায়ী শার্ড করুন যাতে প্রতিটি শার্ডের নিজস্ব হট পাথ থাকে।\n\nকনজিউমার সাইডে একক কনজিউমার অর্ডারিং গুরুত্বপূর্ণ হলে সবচেয়ে স্থির সময় দেয়, কারণ স্টেট একটি থ্রেডেই থাকে। ওয়ার্কার পুল ব্যবহার করার সময় কাজ স্বাধীন হলে ভালো, কিন্তু তারা শিডিউলিং দেরি যোগ করে এবং যত্ন না নিলে কাজ পুনরায় অর্ডার করতে পারে।\n\nব্যাচিং আরেকটি ট্রেডঅফ। ছোট ব্যাচ ওভারহেড কমায় (কম wakeups, কম ক্যাশ মিস), কিন্তু ব্যাচিংও অপেক্ষা বাড়াতে পারে যদি আপনি ব্যাচ পূরণের জন্য ইভেন্ট ধরে রাখেন। যদি আপনি রিয়েল-টাইম সিস্টেমে ব্যাচ করেন, অপেক্ষার সময়বস্তু সীমা দিন (উদাহরণ: “অধিকতম 16 ইভেন্ট বা 200 মাইক্রোসেকেন্ড, যেটাই আগে হয়”)।\n\nসার্ভিস বাউন্ডারগুলোও গুরুত্বপূর্ণ। ইন-প্রসেস মেসেজিং সাধারণত ভাল যখন টাইট ল্যাটেন্সি দরকার। স্কেলিংয়ের জন্য নেটওয়ার্ক হপ দরকার হতে পারে, কিন্তু প্রতিটি হপ কিউ, রিট্রাই, এবং পরিবর্তনশীল ডিলে যোগ করে। যদি হপ নিতে হয়, প্রোটোকল সহজ রাখুন এবং হট পাথে fan-out এড়িয়ে চলুন।\n\nএকটি ব্যবহারিক নিয়ম: যেখানে সম্ভব একক-রাইটার পাথ প্রতি শার্ড রাখুন, শেয়ার না করে কী-ভিত্তিক শার্ডিং করে স্কেল করুন, ব্যাচিং শুধুমাত্র কঠোর সময়-সীমা দিয়ে করুন, কেবল বাস্তবে স্বাধীন ওয়ার্কের জন্য ওয়ার্কার পুল যোগ করুন, এবং প্রতিটি নেটওয়ার্ক হপকে পরিমাপ না হওয়া পর্যন্ত একটি সম্ভাব্য জিটার উৎস হিসেবে বিবেচনা করুন।\n\n## ধাপে ধাপে: একটি লো-জিটার পাইপলাইন ডিজাইন করা\n\nকোডে হাত দেওয়ার আগে একটি লিখিত ল্যাটেন্সি বাজেট দিয়ে শুরু করুন। একটি লক্ষ্য বেছে নিন (কি “ভাল” মনে হবে) এবং একটি p99 (আপনাকে নিচে রাখতে হবে) বসান। সেই সংখ্যাকে ইনপুট, ভ্যালিডেশন, ম্যাচিং, পার্সিস্টেন্স, এবং আউটবাউন্ড আপডেটের মতো স্টেজগুলিতে ভাগ করুন। যদি কোনো স্টেজের বাজেট না থাকে, তার মানে ঐ স্টেজের কোনো সীমা নেই।\n\nপরবর্তী, পুরো ডেটা ফ্লো আঁকুন এবং প্রতিটি হ্যান্ডঅফ চিহ্নিত করুন: থ্রেড বাউন্ডারি, কিউ, নেটওয়ার্ক হপ, এবং স্টোরেজ কল। প্রতিটি হ্যান্ডঅফই জিটারের চোগান জায়গা। আপনি যখন সেগুলো দেখতে পাবেন, তখন আপনি সেগুলো কমাতে পারবেন।\n\nএকটি কার্যপ্রবাহ যা ডিজাইনকে সতর্ক রাখে:\n\n- প্রতিটি স্টেজের জন্য একটি ল্যাটেন্সি বাজেট লিখুন (টার্গেট ও p99), পাশাপাশি অজানার জন্য ছোট একটি বাফার।
সাধারণ প্রশ্ন
Why does my app feel laggy when average latency looks great?
Averages hide rare pauses. If most actions are fast but a few take much longer, users notice the spikes as stutter or “lag,” especially in real-time flows where rhythm matters.
Track tail latency (like p95/p99) because that’s where the noticeable pauses live.
What’s the difference between throughput and latency in real-time systems?
Throughput is how much work you finish per second. Latency is how long one action takes end-to-end.
You can have high throughput while still having occasional long waits, and those waits are what make real-time apps feel slow.
What does p95/p99 latency actually tell me, and why should I care?
Tail latency (p95/p99) measures the slowest requests, not the typical ones. p99 means 1% of operations take longer than that number.
In real-time apps, that 1% often shows up as visible jitter: audio pops, rubber-banding, flickering indicators, or missed ticks.
Where does end-to-end latency usually come from if my code is fast?
Most time is usually spent waiting, not computing:
Network delays and retries
Queueing behind other work
Thread scheduling and context switches
Storage stalls (locks, cache misses, disk flushes)
Serialization and copying
A 2 ms handler can still produce 60–80 ms end-to-end if it waits in a few places.
What are the most common causes of latency spikes (jitter) beyond algorithms?
Common jitter sources include:
Garbage collection or allocator contention
Lock contention (convoys on “usually free” locks)
Cache misses from pointer-heavy or scattered data
Blocking I/O in the hot path (logging, DNS, disk, synchronous calls)
Too many thread handoffs and queues
To debug, correlate spikes with allocation rate, context switches, and queue depth.
What is the Disruptor pattern in plain terms?
Disruptor is a pattern for moving events through a pipeline with small, consistent delays. It uses a preallocated ring buffer and sequence numbers instead of a typical shared queue.
The goal is to reduce unpredictable pauses from contention, allocation, and wakeups—so latency stays “boring,” not just fast on average.
How do preallocation and object reuse help predictable latency?
Preallocate and reuse objects/buffers in the hot loop. This reduces:
Garbage collection pressure
Heap growth surprises
Random allocator slowdowns
Also keep event data compact so the CPU touches less memory per event (better cache behavior).
Should I use a single-threaded loop, sharding, or a worker pool for real-time processing?
Start with a single-writer path per shard when you can (easier to reason about, less contention). Scale by sharding keys (like userId/instrumentId) instead of having many threads fight over one shared queue.
Use worker pools only for truly independent work; otherwise you often trade throughput gains for worse tail latency and harder debugging.
When does batching help, and when does it hurt latency?
Batching reduces overhead, but it can add waiting if you hold events to fill a batch.
A practical rule is to cap batching by time and size (for example: “up to N events or up to T microseconds, whichever comes first”) so batching can’t silently break your latency budget.
What’s a practical step-by-step way to design a low-jitter pipeline?
Write a latency budget first (target and p99), then split it across stages. Map every handoff (queues, thread pools, network hops, storage calls) and make waiting visible with metrics like queue depth and per-stage time.
Keep blocking I/O off the critical path, use bounded queues, and decide overload behavior up front (drop, shed load, coalesce, or backpressure). If you’re prototyping on Koder.ai, Planning Mode can help you sketch these boundaries early, and snapshots/rollback make it safer to test changes that affect p99.
পাইপলাইন ম্যাপ করুন এবং কিউ, লক, আলোকেশন, ও ব্লকিং কল চিহ্নিত করুন।
একটি কনকার্নসি মডেল বেছে নিন যা আপনি যুক্তি করে বুঝতে পারেন (সিঙ্গেল রাইটার, কী অনুযায়ী পার্টিশন করা ওয়ার্কার, বা ডেডিকেটেড I/O থ্রেড)।
ব্যাকপ্রেশার নিয়ম আগেই নির্ধারণ করুন: ড্রপ, ডিলে, ডিগ্রেড, বা লোড শেডিং। এটাকে দৃশ্যমান ও পরিমাপযোগ্য করুন।\n\nতারপর সিদ্ধান্ত নিন কী কী অ্যাসিঙ্ক্রোনাস করা যায় ব্যবহারকারীর অভিজ্ঞতা নষ্ট না করে। একটি সহজ নিয়ম: যা কিছু ব্যবহারকারী এখনই দেখতে পায় তা ক্রিটিকাল পাথেই থাকবে। অনান্য সবকিছু বাইরে পাঠান।\n\nঅ্যানালিটিক্স, অডিট লগ, এবং সেকেন্ডারি ইনডেক্সিং প্রায়শই হট পাথ থেকে পুশ করা নিরাপদ। ভ্যালিডেশন, অর্ডারিং, এবং পরবর্তী অবস্থা উৎপাদনের জন্য প্রয়োজনীয় ধাপগুলো সাধারণত থাকতে হবে।\n\n## রানটাইম এবং OS পছন্দগুলো যা tail latency প্রভাবিত করে\n\nদ্রুত কোডও তখন ধীর অনুভূত হতে পারে যখন রানটাইম বা OS আপনার কাজ ভুল মুহূর্তে থামায়। লক্ষ্য কেবল উচ্চ throughput নয়—এটি হচ্ছে সবচেয়ে ধীর 1% অনুরোধে কম বিস্ময়।\n\nGarbage-collected runtimes (JVM, Go, .NET) প্রোডাক্টিভিটির জন্য দুর্দান্ত হতে পারে, কিন্তু মেমোরি ক্লিনআপের সময় বিরতি আনতে পারে। আধুনিক কালেক্টর গুলো পুরনোরচেয়ে অনেক উন্নত, তবু লোডে প্রচুর ক্ষণজীবী অবজেক্ট তৈরি করলে tail latency লাফ বসাতে পারে। Non-GC ভাষা (Rust, C, C++) GC বিরতি এড়ায়, কিন্তু ম্যানুয়াল মেমোরি ও আলোকেশন ডিসিপ্লিন চাপিয়ে দেয়। যাই হোক, মেমোরি আচরণ CPU গতি যতটুকু গুরুত্বপূর্ণ তার সমানভাবে দরকার।\n\nপ্রায়োগিক অভ্যাস সহজ: যেখানে আলোকেশন হচ্ছে তা খুঁজে বের করুন এবং সেগুলোকে “বোরিং” বানান। অবজেক্ট পুনঃব্যবহার করুন, বাফার প্রি-সাইজ করুন, এবং হট-পাথ ডেটাকে অস্থায়ী স্ট্রিং বা ম্যাপে পরিণত করার চেষ্টা ন করুন।\n\nথ্রেডিং পছন্দগুলোও জিটার হিসেবে দেখা দেয়। প্রতিটি অতিরিক্ত কিউ, অ্যাসিঙ্ক হপ, বা থ্রেডপুল হ্যান্ডঅফ অপেক্ষা বাড়ায় এবং ভ্যারিয়েন্স বাড়ায়। কম সংখ্যক দীর্ঘস্থায়ী থ্রেড পছন্দ করুন, প্রডিউসার-কনজিউমার সীমা পরিষ্কার রাখুন, এবং হট-পাথে ব্লকিং কল এড়িয়ে চলুন।\n\nকিছু OS ও কনটেইনার সেটিংস প্রায়ই নির্ধারণ করে tail পরিষ্কার থাকবে না কি স্পাইকি হবে। CPU থ্রোটলিং, শেয়ার্ড হোস্টে noisy neighbors, এবং খারাপভাবে স্থাপিত লগিং বা মেট্রিকস হঠাৎ ধীরতা সৃষ্টি করতে পারে। যদি আপনি একটাই বদলাতে চান, allocation rate ও context switches মাপুন latency স্পাইক সময়ে।\n\n## ডেটা, স্টোরেজ, এবং সার্ভিস বাউন্ডারি যাতে অপ্রত্যাশিত বিরতি না হয়\n\nঅনেক ল্যাটেন্সি স্পাইক “ধীর কোড” নয়—এগুলো অপ্রত্যাশিত অপেক্ষা: ডাটাবেস লক, রিট্রাই ঝড়, একটি ক্রস-সার্ভিস কল যা আটকে যায়, বা ক্যাশ মিস যা ফুল রাউন্ড ট্রিপে পরিণত হয়।\n\nক্রিটিকাল পাথ ছোট রাখুন। প্রতিটি অতিরিক্ত হপ শিডিউলিং, সিরিয়ালাইজেশন, নেটওয়ার্ক কিউ, এবং ব্লক করার আরও জায়গা যোগ করে। যদি আপনি একটি প্রসেস এবং একটি ডেটা স্টোর থেকে উত্তর দিতে পারেন, সেটাই প্রথমে করুন। সার্ভিসে ভাগ করুন কেবল তখনই যখন প্রতিটি কল ঐচ্ছিক বা কড়াভাবে সীমাবদ্ধ।\n\nবাউন্ডেড অপেক্ষা দ্রুত গড় ও পূর্বানুমেয় ল্যাটেন্সির মধ্যে পার্থক্য তৈরি করে। রিমোট কলগুলিতে কঠোর টাইমআউট দিন, এবং ডিপেন্ডেন্সি অসুস্থ হলে দ্রুত ব্যর্থ করুন। সার্কিট ব্রেকার শুধু সার্ভার বাঁচানোর জন্য নয়—এগুলো সীমা দেয় কতক্ষণ ব্যবহারকারী আটকে থাকতে পারে।\n\nডেটা অ্যাক্সেস ব্লক করলে পথগুলো আলাদা করুন। রিড সাধারণত index-ভিত্তিক, denormalized, cache-friendly আকার চায়। রাইটগুলো প্রায়ই durability ও ordering চায়। সেগুলো আলাদা করে দিলে কনটেনশন কমে এবং লক সময় কমে। যদি কনসিস্টেন্সি অনুমতি দেয়, append-only রেকর্ড (একটি ইভেন্ট লগ) প্রায়ই ইন-প্লেস আপডেটের থেকে বেশি পূর্বানুমেয় আচরণ করে যা hot-row locking বা ব্যাকগ্রাউন্ড মেইনটেন্যান্স ট্রিগার করে।\n\nরিয়েল-টাইম অ্যাপের সহজ নিয়ম: পার্সিস্টেন্স ক্রিটিকাল পাথেই থাকা উচিত না যতক্ষণ না আপনি সত্যই সেটি সঠিকতার জন্য প্রয়োজন। প্রায়ই ভাল পদ্ধতি হলো: মেমোরিতে আপডেট করা, উত্তর পাঠানো, তারপর অ্যাসিঙ্ক কনজিউমারকে ব্যাচ করে PostgreSQL-এ লিখতে দিন (replay মেকানিজম যেমন outbox বা write-ahead log ব্যবহার করে)।\n\nঅনেক রিং-বাফার পাইপলাইনে এটি এভাবে হয়: ইন-মেমোরি বাফারে প্রকাশ করুন, স্টেট আপডেট করুন, প্রতিক্রিয়া পাঠান, তারপর আলাদা কনজিউমার PostgreSQL-এ ব্যাচ লিখে।\n\n## বাস্তবসম্মত উদাহরণ: পূর্বানুমেয় ল্যাটেন্সি সহ রিয়েল-টাইম আপডেট\n\nএকটি লাইভ সহযোগিতা অ্যাপ (বা একটি ছোট মাল্টিপ্লেয়ার গেম) কল্পনা করুন যা প্রতি 16 ms-এ আপডেট ঠেলে দেয় (প্রায় 60 বার প্রতি সেকেন্ড)। লক্ষ্যটি গড়ে “দ্রুত” হওয়া নয়—এটি হলো “সাধারণত 16 ms-এর নিচে থাকা,” এমনকি একজন ব্যবহারকারীর কানেকশন খারাপ থাকলেও।\n\nএকটি সহজ Disruptor-স্টাইল ফ্লো দেখতে এমন: ইউজার ইনপুট একটি ছোট ইভেন্ট হয়, সেটি প্রি-অ্যালোকেটেড রিং বাফারে প্রকাশ করা হয়, তারপর একটি স্থির হ্যান্ডলার সেট অর্ডারে প্রক্রিয়া করে (validate -> apply -> prepare outbound messages), এবং পরে ক্লায়েন্টদের কাছে ব্রডকাস্ট করা হয়।\n\nব্যাচিং এজগুলোতে সাহায্য করতে পারে। উদাহরণস্বরূপ, প্রতি টিকে ক্লায়েন্ট-ওয়াইজে আউটবাউন্ড লেখাগুলো ব্যাচ করুন যাতে আপনি নেটওয়ার্ক লেয়ারকে কমবার কল দেন। কিন্তু হট-পাথে এমনভাবে ব্যাচিং করবেন না যে আপনি “আরও কিছু ইভেন্টের” জন্য অপেক্ষা করে ফেলেন। অপেক্ষা করাই টিক মিস করার কারণ।\n\nকিছু ধীর হলে এটাকে কন্টেইনমেন্ট সমস্যা হিসেবে বিবেচনা করুন। যদি একটি হ্যান্ডলার ধীর হয়ে যায়, সেটিকে আলাদা বাফারের পিছনে আইসোলেট করুন এবং মেইন লুপ ব্লক করার পরিবর্তে একটি লাইটওয়েট ওয়ার্ক আইটেম প্রকাশ করুন। যদি একটি ক্লায়েন্ট ধীর হয়, তাকে ব্রডকাস্টারের ব্যাকআপ হতে দেবেন না; প্রতিটি ক্লায়েন্টকে একটি ছোট সেন্ড কিউ দিন এবং পুরানো আপডেট ড্রপ বা কওলিজ করুন যাতে আপনি সর্বশেষ স্টেট রাখেন। যদি বাফার ডেপথ বাড়ে, এজে ব্যাকপ্রেশার প্রয়োগ করুন (অতিরিক্ত ইনপুট গ্রহণ বন্ধ করুন বা ফিচার ডিগ্রেড করুন)।\n\nআপনি জানবেন এটা কাজ করছে যখন সংখ্যাগুলো বিরল হবে: ব্যাকলগ ডেপথ শূন্যের কাছে ঘোরে, ড্রপ/কোয়ালেসক করা ইভেন্ট দুর্লভ ও বর্ণনাযোগ্য, এবং p99 আপনার টিক বাজেটের নিচে থাকে বাস্তবসম্মত লোডে।\n\n## ল্যাটেন্সি স্পাইক তৈরি করে এমন সাধারণ ভুলগুলো\n\nঅধিকাংশ ল্যাটেন্সি স্পাইক নিজেই সৃষ্টি করে। কোড দ্রুত হতে পারে, কিন্তু সিস্টেম থামে যখন এটি অন্য থ্রেড, OS, বা CPU ক্যাশের বাইরে কিছু অপেক্ষা করে।\n\nকিছু ভুল বারবার দেখা যায়:\n\n- সহজ মনে হয়ে সকল জায়গায় শেয়ার্ড লক ব্যবহার করা। একটি কনটেন্ডেড লক অনেক request আটকাতে পারে।
হট-পাথে ধীর I/O মেশানো, যেমন synchronous logging, ডাটাবেস লেখা, বা রিমোট কল।
অনবাউন্ডেড কিউ রাখা। এগুলো ওভারলোড লুকায় যতক্ষণ না আপনার কাছে সেকেন্ডের ব্যাকলগ থাকে।
গড় দেখা, p95 ও p99 দেখা নয়।
আগেভাগে অতিরিক্ত টিউনিং করা। থ্রেড পিন করা সাহায্য করবে না যদি বিলম্বগুলো GC, কনটেনশন, বা সকেটে অপেক্ষার কারণে আসে।\n\nস্পাইক কমাতে দ্রুত উপায় হলো অপেক্ষাগুলো দৃশ্যমান ও সীমাবদ্ধ করা। ধীর কাজ আলাদা পথে রাখুন, কিউ ক্যাপ করুন, এবং পূর্ণ হলে কী হবে তা নির্ধারণ করুন (ড্রপ, শেড, বা ডিগ্রেড)।\n\n## পূর্বানুমেয় ল্যাটেন্সির দ্রুত চেকলিস্ট\n\nপূর্বানুমেয় ল্যাটেন্সিকে একটি প্রোডাক্ট ফিচারের মতো বিবেচনা করুন, দুর্ঘটনাবশ নয়। কোড টিউনিং করার আগে সিস্টেমে স্পষ্ট লক্ষ্য ও গার্ডরেইল আছে কি না তা নিশ্চিত করুন।\n\n- একটি স্পষ্ট p99 লক্ষ্য নির্ধারণ করুন (যদি প্রয়োজন হয় p99.9), তারপর প্রতিটি স্টেজে ল্যাটেন্সি বাজেট লিখুন।
হট পাথকে ব্লকিং I/O মুক্ত রাখুন। যদি I/O অনিবার্য হয়, সেটি সাইড পাথে সরান এবং তা ধীর হলে আপনি কী করবেন তা নির্ধারণ করুন।
সীমাবদ্ধ কিউ ব্যবহার করুন এবং ওভারলোড আচরণ নির্ধারণ করুন (ড্রপ, শেড লোড, কোয়ালেসক, বা ব্যাকপ্রেশার)।
ধারাবাহিকভাবে মাপুন: ব্যাকলগ ডেপথ, প্রতিস্থাপিত স্টেজ সময়, এবং টেইল ল্যাটেন্সি।
হট লুপে আলোকেশন কমান এবং প্রোফাইল থেকে সহজেই তা চিহ্নিত হতে দিন।\n\nএকটি সহজ পরীক্ষা: একটি বিস্ফোরণ সিমুলেট করুন (সাধারণ ট্র্যাফিকের 10x, 30 সেকেন্ড)। যদি p99 বিস্ফোরিত হয়, জিজ্ঞাসা করুন অপেক্ষা কোথায় ঘটছে: বৃদ্ধি পাচ্ছে কিউ, ধীর কনজিউমার, একটি GC বিরতি, অথবা একটি শেয়ার্ড রিসোর্স।\n\n## পরবর্তী ধাপ: আপনার নিজস্ব অ্যাপে এটি কীভাবে প্রয়োগ করবেন\n\nDisruptor প্যাটার্নকে একটি ওয়ার্কফ্লো হিসেবে দেখুন, লাইব্রেরি পছন্দ হিসেবে নয়। একটি পাতলা স্লাইস দিয়ে পূর্বানুমেয় ল্যাটেন্সি প্রমাণ করুন তার আগে ফিচার যোগ করবেন।\n\nএকটি ইউজার অ্যাকশন বেছে নিন যা তৎক্ষণাত মনে হওয়া উচিত (উদাহরণ: “নতুন প্রাইস আসে, UI আপডেট করে”)। এন্ড-টু-এন্ড বাজেট লিখুন, তারপর দিন একশন-ওয়াইজ p50, p95, ও p99 মাপা শুরু করুন।\n\nএকটি ধারা যা কার্যকর প্রমাণিত হয়:\n\n- একটি পাতলা পাইপলাইন বানান: এক ইনপুট, এক কোর লুপ, এক আউটপুট। লোডে প্রাথমিকভাবে p99 যাচাই করুন।
দায়িত্বগুলো স্পষ্ট করুন (কে স্টেট owns করে, কে প্রকাশ করে, কে কনজিউম করে), এবং শেয়ার্ড স্টেট ছোট রাখুন।
ছোট ধাপে concurrency ও buffering যোগ করুন, এবং পরিবর্তন সহজে উল্টে নেওয়া যায় এমন রাখুন।
বাজেট টাইট হলে ব্যবহারকারীর কাছে নিকট ডিপ্লয় করুন, তারপর বাস্তবসম্মত লোডে আবার মাপুন (একই পে-লোড সাইজ, একই বার্স্ট প্যাটার্ন)।\n\nযদি আপনি Koder.ai (koder.ai) ব্যবহার করে তৈরি করে থাকেন, প্রথমে ইভেন্ট ফ্লো ম্যাপ করা সাহায্য করতে পারে Planning Mode-এ যাতে কিউ, লক, ও সার্ভিস বাউন্ডারি ভুল করে না তৈরি হয়। স্ন্যাপশট ও রোলব্যাক পুনরাবৃত্তি ল্যাটেন্সি পরীক্ষা চালাতে ও সেইসব পরিবর্তনগুলো ফিরিয়ে আনতে সহজ করে।\n\nমাপগুলোকে সৎ রাখুন। একটি স্থির টেস্ট স্ক্রিপ্ট ব্যবহার করুন, সিস্টেমকে ওয়র্ম-আপ করুন, এবং throughput ও latency উভয়ই রেকর্ড করুন। যখন লোডে p99 লাফ দেয়, কোড অপ্টিমাইজেশনের দিকে সোজা ঝাঁকাবেন না। প্রথমে GC, noisy neighbors, লগিং বর্ধন, থ্রেড শিডিউলিং, বা লুকানো ব্লকিং কলগুলো খুঁজুন।