

ঘটনা প্রভাব বিশ্লেষণের জন্য ওয়েব অ্যাপ বানানো, ধাপে ধাপে
জানুন কিভাবে একটি ওয়েব অ্যাপ ডিজাইন ও নির্মাণ করবেন যা সার্ভিস নির্ভরতাসমুহ, রিয়েল-টাইম সিগন্যাল, এবং পরিষ্কার ড্যাশবোর্ড ব্যবহার করে ঘটনার প্রভাব গণনা করে।
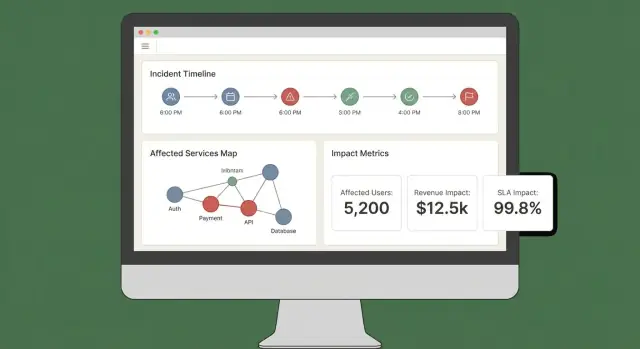
Define Incident Impact and the Decisions It Should Drive
Before you build calculations or dashboards, decide what “impact” actually means in your organization. If you skip this step, you’ll end up with a score that looks scientific but doesn’t help anyone act.
What counts as “impact” (and what doesn’t)
Impact is the measurable consequence of an incident on something the business cares about. Common dimensions include:
- Users: number of users unable to log in, error-rate spikes on key flows, degraded latency for a region.
- Revenue: checkouts failing, subscription renewals blocked, ad impressions dropping.
- SLA/SLO risk: minutes of downtime against an uptime target, error budget burn rate.
- Internal teams: support ticket volume, on-call load, blocked deploys.
Pick 2–4 primary dimensions and define them explicitly. For example: “Impact = affected paying customers + SLA minutes at risk,” not “Impact = anything that looks bad on graphs.”
Who uses the app, and what they need in the first 10 minutes
Different roles make different decisions:
- Incident commanders need a fast, defensible summary: what’s broken, who’s affected, and how it’s trending.
- Support needs customer-facing scope: which accounts, regions, or plans are impacted.
- Engineering needs a blast-radius hypothesis to guide debugging and mitigation.
- Executives need a concise business statement: severity, customer impact, and ETA confidence.
Design “impact” outputs so each audience can answer their top question without translating metrics.
Real-time vs. near-real-time: set expectations early
Decide what latency is acceptable. “Real-time” is expensive and often unnecessary; near-real-time (e.g., 1–5 minutes) may be enough for decision-making.
Write this down as a product requirement because it influences ingestion, caching, and UI.
Decisions the app should enable during an incident
Your MVP should directly support actions such as:
- Declare severity and escalation level
- Trigger customer communications (status page, support macros)
- Prioritize mitigation work (which service/team first)
- Decide on rollbacks, feature flags, or traffic shifts
- Identify which customers need proactive outreach
If a metric doesn’t change a decision, it’s probably not “impact”—it’s just telemetry.
Requirements Checklist: Inputs, Outputs, and Constraints
Before you design screens or pick a database, write down what “impact analysis” must answer during a real incident. The goal isn’t perfect precision on day one—it’s consistent, explainable results that responders can trust.
Required inputs (the minimum you need)
Start with the data you must ingest or reference to calculate impact:
- Incidents: ID, start/end times, status, owning team, summary, links to the incident channel/ticket.
- Services: canonical service list (name, owner, tier/criticality, runbook link).
- Dependencies: which services rely on which others (even if the first version is coarse).
- Telemetry signals: alerts, SLO burn rates, error rate/latency, deployment events—anything that indicates degradation.
- Customer accounts: account IDs, plan/SLA, region, key contacts, plus how accounts map to services (directly or via workloads).
Optional at launch (plan for it, don’t require it)
Most teams don’t have perfect dependency or customer mapping on day one. Decide what you’ll allow people to enter manually so the app is still useful:
- Manual selection of affected services/customers when data is missing
- Estimated start time or scope when telemetry is delayed
- Overrides with reasons (e.g., “false positive alert,” “internal-only impact”)
Design these as explicit fields (not ad-hoc notes) so they’re queryable later.
Key outputs (what the app must produce)
Your first release should reliably generate:
- Affected services and a clear “why” (signals + dependencies)
- Customer list with counts by plan/region and a “top accounts” view
- Severity/impact score that can be explained in plain language
- Timeline of when impact likely started, peaked, and recovered
- Optional but valuable: a cost estimate (SLA credits, support load, revenue risk) with confidence ranges
Non-functional constraints (what makes it trustworthy)
Impact analysis is a decision tool, so constraints matter:
- Latency: dashboards should load in seconds during an incident
- Uptime: treat it like internal critical tooling; define an availability target
- Auditability: log who changed an override, when, and what the previous value was
- Access control: restrict sensitive customer data; separate read vs. write permissions
Write these requirements as testable statements. If you can’t verify it, you can’t rely on it during an outage.
Data Model: Incidents, Services, Dependencies, and Customers
Your data model is the contract between ingestion, calculation, and the UI. If you get it right, you can swap tooling sources, refine scoring, and still answer the same questions: “What broke?”, “Who is affected?”, and “For how long?”
Core entities (keep them small and linkable)
At minimum, model these as first-class records:
- Incident: the narrative container (title, severity, status, owner), plus pointers to evidence.
- Service: the unit you map dependencies for (API, database, queue, third-party provider).
- Dependency: a directed edge service A → service B with metadata (type, criticality).
- Signal: a time-stamped observation (alert, SLO burn, error spike, synthetic check failure).
- Customer: an account or organization that consumes services.
- Subscription/SLA: what a customer is entitled to (plan, SLA/SLO targets, reporting rules).
Keep IDs stable and consistent across sources. If you already have a service catalog, treat it as the source of truth and map external tool identifiers into it.
Time modeling (impact is a time-window problem)
Store multiple timestamps on the incident to support reporting and analysis:
- start_time / end_time: actual impact window (can be refined later)
- detection_time: when you first knew
- mitigation_time: when fixes started reducing impact
Also store calculated time windows for impact scoring (e.g., 5-minute buckets). This makes replay and comparisons straightforward.
Relationships that power “who is affected?”
Model two key graphs:
- Service-to-service dependencies (blast radius)
- Customer-to-service usage (affected scope)
A simple pattern is customer_service_usage(customer_id, service_id, weight, last_seen_at) so you can rank impact by “how much the customer relies on it.”
Versioning and history (dependencies change)
Dependencies evolve, and impact calculations should reflect what was true at the time. Add effective dating to edges:
dependency(valid_from, valid_to)
Do the same for customer subscriptions and usage snapshots. With historical versions, you can accurately re-run past incidents during post-incident review and produce consistent SLA reporting.
Collecting and Normalizing Data from Your Tooling
Your impact analysis is only as good as the inputs feeding it. The goal here is straightforward: pull signals from the tools you already use, then convert them into a consistent event stream your app can reason about.
What to ingest (and why)
Start with a short list of sources that reliably describe “something changed” during an incident:
- Monitoring alerts (PagerDuty, Opsgenie, CloudWatch alarms): fast indicators of symptoms and severity
- Logs and traces (ELK, Datadog, OpenTelemetry backends): evidence of scope (which endpoints, which customers)
- Status page updates (Statuspage, Cachet): the official narrative and customer-facing timestamps
- Ticketing/incident tools (Jira, ServiceNow): ownership, timestamps, and post-incident data
Don’t try to ingest everything at once. Pick sources that cover detection, escalation, and confirmation.
Ingestion methods to choose from
Different tools support different integration patterns:
- Webhooks for near-real-time updates (best for alerts and status pages)
- Polling for APIs without webhooks (use backoff and rate limits)
- Batch imports for historical backfills (useful for initial validation)
- Manual entry for “last mile” corrections (an analyst can fix a missing service tag)
A practical approach is: webhooks for critical signals, plus batch imports to fill gaps.
Normalize into a common schema
Normalize every incoming item into a single “event” shape, even if the source calls it an alert, incident, or annotation. At minimum, standardize:
- Timestamp(s): occurred_at, detected_at, resolved_at (when available)
- Service identifiers: map source tags/names to your canonical service IDs
- Severity/priority: convert tool-specific levels into your scale
- Source and raw payload: keep the original JSON for audit and debugging
Data hygiene: duplicates, ordering, missing fields
Expect messy data. Use idempotency keys (source + external_id) to deduplicate, tolerate out-of-order events by sorting on occurred_at (not arrival time), and apply safe defaults when fields are missing (while flagging them for review).
A small “unmatched service” queue in the UI prevents silent errors and keeps your impact results trustworthy.
Mapping Service Dependencies for Accurate Blast Radius
If your dependency map is wrong, your blast radius will be wrong—even if your signals and scoring are perfect. The goal is to build a dependency graph you can trust during an incident and also afterward.
Start with a service catalog (your “source of truth”)
Before you map edges, define the nodes. Create a service catalog entry for every system you might reference in an incident: APIs, background workers, data stores, third-party vendors, and other critical shared components.
Each service should include at least: owner/team, tier/criticality (e.g., customer-facing vs. internal), SLA/SLO targets, and links to runbooks and on-call docs (for example, /runbooks/payments-timeouts).
Capture dependencies: static vs. learned
Use two complementary sources:
- Static (declared) dependencies: what teams say they depend on (from IaC, config, service manifests, ADRs). Stable and easy to audit.
- Learned (observed) dependencies: what your systems actually call (from traces, service mesh telemetry, API gateway logs, egress proxies, database audit logs). These catch “unknown unknowns,” like a forgotten downstream call.
Treat these as separate edge types so people can understand confidence: “declared by team” vs. “observed in last 7 days.”
Directionality and criticality matter
Dependencies should be directional: Checkout → Payments is not the same as Payments → Checkout. Direction drives reasoning (“if Payments is degraded, which upstreams might fail?”).
Also model hard vs. soft dependencies:
- Hard: failure blocks core functionality (auth service for login).
- Soft: degradation reduces quality but has a fallback (recommendations, optional enrichment).
This distinction prevents overstating impact and helps responders prioritize.
Snapshot the graph for replay and post-incident analysis
Your architecture changes weekly. If you don’t store snapshots, you can’t accurately analyze an incident from two months ago.
Persist dependency graph versions over time (daily, per deploy, or on change). When calculating blast radius, resolve the incident timestamp to the closest graph snapshot, so “who was affected” reflects reality at that moment—not today’s architecture.
Impact Calculation: From Signals to Scores and Affected Scope
Once you’re ingesting signals (alerts, SLO burn, synthetic checks, customer tickets), the app needs a consistent way to turn messy inputs into a clear statement: what is broken, how bad is it, and who is affected?
Pick a scoring approach (start simple)
You can get to a usable MVP with any of these patterns:
- Rule-based scoring: “If checkout error rate > 5% for 10 minutes, impact = High.” Easy to explain and debug.
- Weighted formula: Combine normalized metrics into a single score (e.g., 0–100). Useful when you have many signals and want a smooth curve.
- Tier-based mapping: Map systems to business tiers (Tier 0–3) and cap or boost severity based on tier. This keeps outcomes aligned with business priorities.
Whichever approach you choose, store the intermediate values (threshold hit, weights, tier) so people can understand why the score happened.
Define impact dimensions
Avoid collapsing everything into one number too early. Track a few dimensions separately, then derive an overall severity:
- Availability: downtime, failed requests, unreachable endpoints
- Latency: p95/p99 degradation against a baseline or SLO
- Errors: error rate spikes, failed jobs, timeouts
- Data correctness: missing/incorrect records, delayed processing
- Security risk: suspicious access patterns, data exposure indicators
This helps responders communicate precisely (e.g., “available but slow” vs. “incorrect results”).
Compute affected scope (customers/users)
Impact isn’t only service health—it’s who felt it.
Use usage mapping (tenant → service, customer plan → features, user traffic → endpoint) and calculate affected customers within a time window aligned to the incident (start time, mitigation time, and any backfill period).
Be explicit about assumptions: sampled logs, estimated traffic, or partial telemetry.
Manual adjustments—with accountability
Operators will need to override: a false-positive alert, a partial rollout, a known subset of tenants.
Allow manual edits to severity, dimensions, and affected customers, but require:
- Who changed what
- When
- Why (short reason + optional link to ticket/runbook)
This audit trail protects trust in the dashboard and makes post-incident review faster.
UX and Dashboards: Make Impact Understandable in Minutes
A good impact dashboard answers three questions quickly: What’s affected? Who’s affected? How sure are we? If users have to open five tabs to piece that together, they won’t trust the output—or act on it.
Core views to ship in the MVP
Start with a small set of “always-there” views that map to real incident workflows:
- Incident overview: status, start time, current impact score, top affected services/customers, and the most recent evidence.
- Affected services: a ranked list showing severity, region, and the dependency path (so engineers can spot where to intervene).
- Affected customers: counts and named accounts by tier/plan, plus estimated user impact if you track it.
- Timeline: a single chronological stream combining detections, deploys, alerts, mitigations, and impact changes.
- Actions: suggested next steps, owners, and links to playbooks or tickets.
Make the “why” visible
Impact scores without explanation feel arbitrary. Every score should be traceable back to inputs and rules:
- Show which signals contributed (errors, latency, health checks, support volume) and their current values.
- Display rules and thresholds used (e.g., “latency p95 > 2s for 10 min = degraded”).
- Add a lightweight confidence indicator (e.g., “High confidence: confirmed by 3 sources”).
A simple “Explain impact” drawer or panel can do this without cluttering the main view.
Filters and drilldowns that match real questions
Make it easy to slice impact by service, region, customer tier, and time range. Let users click any chart point or row to drill into raw evidence (the exact monitors, logs, or events that drove the change).
Sharing and exports
During an active incident, people need portable updates. Include:
- Shareable links to the incident view (respecting permissions)
- CSV export for service/customer lists
- PDF export for status updates and post-incident summaries
If you already have a status page, link to it via a relative route like /status so comms teams can cross-reference quickly.
Security, Permissions, and Audit Logging
Impact analysis is only useful if people trust it—which means controlling who can see what and keeping a clear record of changes.
Roles and permissions (start simple)
Define a small set of roles that match how incidents run in real life:
- Viewer: read-only access to incident summaries and high-level impact.
- Responder: can add notes, confirm affected services, and update operational fields.
- Incident commander: can approve impact overrides, set customer-facing status, and close incidents.
- Admin: manages integrations, role assignments, and data retention.
Keep permissions aligned to actions, not job titles. For example, “can export customer impact report” is a permission you can grant to commanders and a small subset of admins.
Protect sensitive customer data
Incident impact analysis often touches customer identifiers, contract tiers, and sometimes contact details. Apply least privilege by default:
- Mask sensitive fields (e.g., show the last 4 characters of an account ID) unless the user has explicit access.
- Separate “who is impacted” from “what is broken.” Many users only need service-level impact, not customer-level lists.
- Secure exports: watermark PDFs/CSVs, include the requesting user, and restrict exports to approved roles. Prefer short-lived, signed download links.
Audit logging that answers “who changed what?”
Log key actions with enough context to support reviews:
- Manual edits to impact inputs (affected services/customers)
- Impact score overrides (old value, new value, reason)
- Acknowledgments and status transitions
- Report generation and exports
Store audit logs append-only, with timestamps and actor identity. Make them searchable per incident so they’re usable during a post-incident review.
Plan for compliance needs (without overpromising)
Document what you can support now—retention period, access controls, encryption, and audit coverage—and what’s on the roadmap.
A short “Security & Audit” page in your app (e.g., /security) helps set expectations and reduces ad-hoc questions during critical incidents.
Workflows and Notifications During an Active Incident
Impact analysis only matters during an incident if it drives the next action. Your app should behave like a “co-pilot” for the incident channel: it turns incoming signals into clear updates, and it nudges people when the impact meaningfully changes.
Connect to chat and incident channels
Start by integrating with the place responders already work (often Slack, Microsoft Teams, or a dedicated incident tool). The goal isn’t to replace the channel—it’s to post context-aware updates and keep a shared record.
A practical pattern is to treat the incident channel as both an input and an output:
- Input: responders tag the app (e.g., “/impact summarize”, “/impact add affected customer Acme”) to correct or enrich scope.
- Output: the app posts concise, consistent updates (current impact score, affected services/customers, trend vs. last update).
If you’re prototyping quickly, consider building the workflow end-to-end first (incident view → summarize → notify) before perfecting scoring. Platforms like Koder.ai can be useful here: you can iterate on a React dashboard and a Go/PostgreSQL backend through a chat-driven workflow, then export the source code once the incident team agrees the UX matches reality.
Threshold-based notifications (not noise)
Avoid alert spam by triggering notifications only when impact crosses explicit thresholds. Common triggers include:
- Scope: affected customers count jumps (e.g., 10 → 100)
- Tier: a Tier 1 service becomes affected
- Revenue / SLA risk: projected SLA breach or high contract value involved
- Blast radius expansion: new dependent services join the affected set
When a threshold is crossed, send a message that explains why (what changed), who should act, and what to do next.
Link to runbooks and workflows
Every notification should include “next-step” links so responders can move quickly:
- Runbooks: /blog/incident-runbook-template
- Escalation policy: /pricing
- Service ownership page: /services/payments
Keep these links stable and relative so they work across environments.
Stakeholder updates: internal and customer-facing
Build two summary formats from the same data:
- Internal update: technical detail, suspected cause, mitigation progress, ETA confidence.
- Customer-facing update: plain language, current user impact, workarounds, next update time.
Support scheduled summaries (e.g., every 15–30 minutes) and on-demand “generate update” actions, with an approval step before sending externally.
Validation: Testing, Replay, and Accuracy Checks
Impact analysis is only useful if people trust it during an incident and after. Validation should prove two things: (1) the system produces stable, explainable results, and (2) those results match what your organization later agrees actually happened.
Testing strategy: rules and pipelines
Start with automated tests that cover the two most failure-prone areas: scoring logic and data ingestion.
- Unit tests for scoring rules: Treat each rule as a contract. Given specific signals (error rate, latency, synthetic checks, ticket volume), your test should assert the expected impact score and affected scope. Include boundary tests (just under/over thresholds) so metric jitter doesn’t flip outcomes unexpectedly.
- Integration tests for ingestion: Validate the full path from webhook/event input to normalized records and computed impact. Use recorded payloads from your observability and incident tools to catch schema drift early.
Keep test fixtures readable: when someone changes a rule, they should be able to understand why a score changed.
Replay past incidents to validate outputs
A replay mode is a fast path to confidence. Run historical incidents through the app and compare what the system would have shown “in the moment” versus what responders concluded later.
Practical tips:
- Reconstruct timelines using event timestamps (not ingestion time) to reflect reality.
- Freeze dependency graphs as-of the incident date if your service catalog has changed.
- Store replay results so you can compare versions after rule tweaks.
Handle edge cases that break naive scoring
Real incidents rarely look like clean outages. Your validation suite should include scenarios like:
- Partial outages (some endpoints or customer segments failing)
- Degraded performance (slow but not failing) where business impact can still be high
- Multi-region failures where the same service has different health per region
For each, assert not only the score, but also the explanation: which signals and which dependencies/customers drove the result.
Measuring accuracy against post-incident findings
Define accuracy in operational terms, then track it.
Compare computed impact to post-incident review outcomes: affected services, duration, customer count, SLA breach, and severity. Log discrepancies as validation issues with a category (missing data, wrong dependency, bad threshold, delayed signal).
Over time, the goal isn’t perfection—it’s fewer surprises and faster agreement during incidents.
Deployment, Scaling, and Iterating After the MVP
Shipping an MVP for incident impact analysis is mostly about reliability and feedback loops. Your first deployment choice should optimize for speed of change, not theoretical future scale.
Pick a deployment style you can evolve
Start with a modular monolith unless you already have a strong platform team and clear service boundaries. One deployable unit simplifies migrations, debugging, and end-to-end testing.
Split into services only when you feel real pain:
- the ingestion pipeline needs independent scaling
- multiple teams need to deploy independently
- failure domains are hard to reason about in a single app
A pragmatic middle ground is one app + background workers (queues) + a separate ingestion edge if needed.
If you want to move fast without committing to a large bespoke platform build up front, Koder.ai can help accelerate the MVP: its chat-driven “vibe-coding” workflow is well-suited to building a React UI, a Go API, and a PostgreSQL data model, with snapshots/rollback when you’re iterating on scoring rules and workflow changes.
Choose storage based on access patterns
Use relational storage (Postgres/MySQL) for core entities: incidents, services, customers, ownership, and calculated impact snapshots. It’s easy to query, audit, and evolve.
For high-volume signals (metrics, logs-derived events), add a time-series store (or columnar store) when raw signal retention and rollups become expensive in SQL.
Consider a graph database only if dependency queries become a bottleneck or your dependency model becomes highly dynamic. Many teams can get far with adjacency tables plus caching.
Add observability for the app itself
Your impact analysis app becomes part of your incident toolchain, so instrument it like production software:
- error rate and slow endpoints (especially “recalculate impact”)
- worker queue depth/lag and retry rates
- ingestion throughput and failure counts per source
- data freshness (time since last successful pull/push)
- calculation duration and cache hit rate
Expose a “health + freshness” view in the UI so responders can trust (or question) the numbers.
Plan iterations and refactors deliberately
Define MVP scope tightly: a small set of tools to ingest, a clear impact score, and a dashboard that answers “who is affected and how much.” Then iterate:
- Next features: better dependency accuracy, customer-specific weighting, SLA reporting exports, replay for past incidents
- Refactor triggers: you’re adding special cases weekly, recalculation is too slow, or the data model can’t express reality without hacks
Treat the model as a product: version it, migrate it safely, and document changes for post-incident review.
সাধারণ প্রশ্ন
What is “incident impact” in this context?
প্রভাব হলো কোনো ঘটনার ব্যবসায়িকভাবে গুরুত্বপূর্ণ আউটকামগুলোর উপর পরিমাপযোগ্য প্রভাব।
একটি ব্যবহারযোগ্য সংজ্ঞা ২–৪টি প্রধান পরিমাপ নির্দিষ্ট করে (উদাহরণ: প্রভাবিত পেইং কাস্টমার + ঝুঁকির মধ্যে থাকা SLA মিনিট), এবং "কেবল গ্রাফে খারাপ দেখে যাওয়া"-কে বাদ দেয়। এতে আউটপুট সিদ্ধান্ত-চালিত থাকে, শুধু টেলিমেট্রি নয়।
Which impact dimensions should we track first?
প্রথম ১০ মিনিটে টিমগুলো যে সিদ্ধান্তগুলো নেয় সেগুলোর সাথে মিল রেখে মাত্রা বাছুন।
সাধারণ, MVP-ফ্রেন্ডলি মাত্রা:
- ব্যবহারকারী/কাস্টমার প্রভাবিত (গণনা, টিয়ার, অঞ্চল)
- রাজস্ব ঝুঁকি (চেকআউট ব্যর্থতা, নবায়ন ব্লক)
- SLA/SLO ঝুঁকি (ডাউনটাইম মিনিট, এরর বাজেট বার্ন)
- অভ্যন্তরীণ লোড (সাপোর্ট ভলিউম, ব্লকড ডিপ্লয়)
এগুলোকে ২–৪টির মধ্যে সীমিত রাখুন যাতে স্কোরটি বোঝা যায়।
Who are the main users of an impact analysis app, and what do they need?
প্রতিটি ব্যবহারকারীর প্রধান প্রশ্নের উত্তর দিতে আউটপুট ডিজাইন করুন, যাতে মেট্রিক অনুবাদ করতে না হয়:
- ইনসিডেন্ট কমান্ডার: দ্রুত সারসংক্ষেপ (কি ভাঙছে, কারা প্রভাবিত, ট্রেন্ড)
- সাপোর্ট: প্রভাবিত অ্যাকাউন্ট/অঞ্চল/প্ল্যান এবং গ্রাহক-সামঞ্জস্যপূর্ণ বিবরণ
- ইঞ্জিনিয়ারিং: ব্লাস্ট-রেডিয়াস হাইপোথেসিস ও মিটিগেশনের জন্য প্রমাণ
- এক্সিকিউটিভস: গুরত্ব, ব্যবসায়িক প্রভাব, এবং ETA কনফিডেন্স
যদি কোনো মেট্রিক এইদের কাউকে সরাসরি সাহায্য না করে, তাহলে সেটি সম্ভবত "প্রভাব" নয়।
How should we set expectations for real-time vs. near-real-time impact data?
“রিয়েল-টাইম” ব্যয়বহুল; অনেক টিম নিয়ার-রিয়েল-টাইম (১–৫ মিনিট)-এ ভালো থাকে।
একটি ল্যাটেন্সি টার্গেট প্রোডাক্ট রিকোয়ায়ারমেন্ট হিসেবে লিখে রাখুন কারণ এটা প্রভাব করে:
- ইনজেশন পদ্ধতি (webhooks বনাম polling)
- ক্যাশিং কৌশল
- UI-এ “কারেন্ট” সংখ্যাগুলোর বিশ্বাসযোগ্যতা
টুল-ইউআইতে ডেটা-ফ্রেশনেস দেখান (উদাহরণ: “ডেটা ২ মিনিট আগে পর্যন্ত তাজা”)।
What decisions should the MVP impact dashboard enable during an incident?
প্রাথমিকভাবে যে সিদ্ধান্তগুলো নেওয়া লাগে সেগুলো তালিকাভুক্ত করুন, তারপর নিশ্চিত করুন প্রতিটি আউটপুট একটা নির্দিষ্ট সিদ্ধান্তকে সাপোর্ট করে:
- সিভারিটি ঘোষণা ও এসক্যালেশন লেভেল নির্ধারণ
- কাস্টমার কমিউনিকেশন ট্রিগার (স্ট্যাটাস পেজ, সাপোর্ট ম্যাক্রো)
- মিটিগেশন অগ্রাধিকার নির্ধারণ (কোন সার্ভিস/টিম আগে)
- রোলব্যাক/ফিচার ফ্ল্যাগ/ট্রাফিক শিফট সিদ্ধান্ত
- কোন কাস্টমারকে প্রোঅ্যাকটিভ যোগাযোগ করতে হবে তা চিহ্নিত
যদি কোনো মেট্রিক সিদ্ধান্ত পরিবর্তন না করে, সেটাকে টেলিমেট্রি হিসেবে রাখুন।
What are the minimum required inputs to calculate incident impact?
গাণিতিকভাবে প্রয়োজনীয় ইনপুটগুলোর একটি সাধারণ তালিকা:
- Incidents: ID, শুরু/শেষ সময়, স্ট্যাটাস, ওউনিং টিম, সারাংশ, ইন্সিডেন্ট চ্যানেল/টিকিটের লিঙ্ক
- Services: canonical সার্ভিস তালিকা (নাম, ওউনার, টিয়ার/ক্রিটিক্যালিটি, রুনবুক লিঙ্ক)
- Dependencies: কোন সার্ভিস কোনটার উপর নির্ভর করে (প্রাথমিকভাবে কোর্স হতে পারে)
- Telemetry signals: alerts, SLO বার্ন, এরর রেট/ল্যাটেন্সি, ডিপ্লয় ইভেন্ট
- Customer accounts: অ্যাকাউন্ট আইডি, প্ল্যান/SLA, অঞ্চল, কনট্যাক্ট, এবং কিভাবে অ্যাকাউন্ট সার্ভিসগুলোর সাথে ম্যাপ করে
এই সেট cukup করে "কি ভাঙল", "কারা প্রভাবিত", এবং "কতক্ষণ" হিসাব করার জন্য।
How do we handle missing data or incorrect signals early on?
ডেটা মিসিং বা ভুল সিগন্যাল হলে ম্যানুয়াল, কুয়েরি-যোগ্য ফিল্ড অনুমোদন করুন:
- ডেটা মিসিং হলে প্রভাবিত সার্ভিস/কাস্টমার ম্যানুয়ালি সিলেক্ট করা
- টেলিমেট্রি দেরি হলে স্টার্ট টাইম বা স্কোপ অনুমান করা
- ওভাররাইড যুক্ত করা এবং কারন লেখা (যেমন: false positive, internal-only impact)
পরিবর্তনগুলোর জন্য কাউ, কখন, কেন প্রয়োজন—এসব সংগ্রহ করুন যাতে বিশ্বাসযোগ্যতা বজায় থাকে।
What outputs should the first release generate?
একটি নির্ভরযোগ্য MVP নিচের জিনিসগুলো জেনারেট করতে পারা উচিত:
- র্যাঙ্ককৃত প্রভাবিত সার্ভিস এবং স্পষ্ট “কেন” (সিগন্যাল + ডিপেন্ডেন্সি পথ)
- প্রভাবিত কাস্টমার তালিকা (প্ল্যান/অঞ্চল অনুযায়ী কাউন্ট) এবং টপ অ্যাকাউন্ট ভিউ
- সহজ ভাষায় ব্যাখ্যা করা যায় এমন সিভারিটি/প্রভাব স্কোর
- টাইমলাইন (কখন প্রভাব শুরু, কখন পিক, কখন রিকভারি)
বিকল্প হিসেবে: আনুমানিক খরচ (SLA ক্রেডিট, সাপোর্ট লোড, রাজস্ব ঝুঁকি) কনফিডেন্স রেঞ্জসহ দেখানো।
How do we collect and normalize data from existing tools?
সব ইনপুটকে একটি কমন ইভেন্ট স্কিমায় নরমালাইজ করুন যাতে গণনা ধারাবাহিক থাকে।
কমপক্ষে স্ট্যান্ডার্ডাইজ করুন:
- টাইমস্ট্যাম্প:
occurred_at,detected_at,resolved_at - ক্যানোনিকাল
service_id(টুল ট্যাগ/নাম থেকে ম্যাপ করা) - ইউনিফাইড সেভারিটি স্কেল
source+ অরিজিনাল র ক্স পে লোড (অডিট/ডিবাগের জন্য)
মেসি ডেটাকে idempotency কী (source + external_id) দিয়ে হ্যান্ডল করুন এবং occurred_at-এর ওপর ভিত্তি করে আউট-অফ-অর্ডার ইভেন্ট টোলারেন্স রাখুন।
What’s a good approach to impact scoring and affected scope calculation?
সরল ও ব্যাখ্যাযোগ্য পদ্ধতি দিয়ে শুরু করুন:
- রুল-ভিত্তিক: স্পষ্ট থ্রেশহোল্ড (ডিবাগ করা সহজ)
- ওয়েটেড ফর্মুলা (0–100): অনেক সিগন্যাল থাকলে স্মুথ স্কোরিং
- টিয়ার-ভিত্তিক ম্যাপিং: ব্যবসায়িক গুরুত্বপূর্ণতার সাথে সংরক্ষণ
ইন্টারমিডিয়েট মান (থ্রেশহোল্ড হিট, ওয়েট, টিয়ার) স্টোর করুন যাতে ব্যবহারকারীরা দেখতে পায় কেন স্কোর এসেছে। প্রভাবের মাত্রাগুলো (availability/latency/errors/data correctness/security) আলাদা রাখুন, তারপর প্রয়োজনে একটা সামগ্রিক নাম্বারে রূপান্তর করুন।
How should manual adjustments be handled?
অপারেটররা ওভাররাইড দেবেন—যেমন false-positive, partial rollout, নির্দিষ্ট টেন্যান্ট।
ওভাররাইডের ক্ষেত্রে আবশ্যক রাখুন:
- কে কি পরিবর্তন করেছে
- কখন
- কেন (সংক্ষিপ্ত কারণ + ঐচ্ছিক টিকিট/রুনবুক লিঙ্ক)
এই অডিট ট্রেইল ড্যাশবোর্ডে বিশ্বাস বজায় রাখে এবং পোস্ট-ইনসিডেন্ট রিভিউকে দ্রুত করে।
What should the UX and dashboards provide in the MVP?
ভাল প্রভাব ড্যাশবোর্ড দ্রুত তিনটি প্রশ্নের উত্তর দেয়: কি প্রভাবিত হচ্ছে? কে প্রভাবিত হচ্ছে? আমরা কতটা নিশ্চিত?
MVP-তে থাকা উচিত কয়েকটি মূল ভিউ:
- Incident overview: স্ট্যাটাস, শুরু সময়, বর্তমান প্রভাব স্কোর, শীর্ষ প্রভাবিত সার্ভিস/কাস্টমার, সাম্প্রতিক এভিডেন্স
- Affected services: র্যাঙ্ককৃত তালিকা—সেভারিটি, অঞ্চল, এবং ডিপেন্ডেন্সি পাথ
- Affected customers: কাউন্ট ও নাম করা অ্যাকাউন্ট (টিয়ার/প্ল্যান অনুসারে)
- Timeline: ডিটেকশন, ডিপ্লয়, অ্যালার্ট, মিটিগেশন, এবং প্রভাব পরিবর্তনগুলো chronological স্ট্রিমে
- Actions: পরবর্তী ধাপ, ওউনার, এবং প্লেবুক/টিকিট লিঙ্ক
প্রতিটি স্কোরের সঙ্গে ব্যাখ্যা দেখান: কোন সিগন্যাল অবদান নিয়েছে, ব্যবহার করা নিয়ম/থ্রেশহোল্ড, এবং কনফিডেন্স ইন্ডিকেটর।
How should workflows and notifications integrate with chat and incident channels?
কন্টেন্ট-রাইটেড চ্যাট/ইনসিডেন্ট চ্যানেলের সাথে ইন্টিগ্রেট করুন (Slack, Teams ইত্যাদি)। লক্ষ্য হচ্ছে চ্যানেল বদলানো নয়—কিন্তু প্রাসঙ্গিক আপডেট পোষ্ট করা এবং শেয়ার করা।
প্র্যাকটিক্যাল প্যাটার্ন:
- ইনপুট: রেসপন্ডাররা অ্যাপকে ট্যাগ করে (উদাহরণ:
/impact summarize,/impact add affected customer Acme) স্কোপ ঠিক করার জন্য - আউটপুট: অ্যাপ সংক্ষেপে আপডেট পোষ্ট করবে (কারেন্ট স্কোর, প্রভাবিত সার্ভিস/কাস্টমার, ট্রেন্ড)
থ্রেশহোল্ড-ভিত্তিক নোটিফিকেশন তৈরি করুন যাতে শব্দবাজি না হয়—ট্রিগারগুলো যেমন: প্রভাবিত কাস্টমার হঠাৎ বেড়ে যাওয়া, টিয়ার 1 সার্ভিস প্রভাবিত হওয়া, SLA ঝুঁকি, ব্লাস্ট-রেডিয়াস বাড়া।
প্রতিটি নোটিফিকেশনে পরবর্তী ধাপের লিংক রাখুন (রুনবুক: /blog/incident-runbook-template, এসক্যালেশন পলিসি: /pricing, সার্ভিস পেজ: /services/payments)।
How should validation, testing, and replay be handled?
টেস্টিং দুটি প্রধান জিনিস কভার করবে: স্কোরিং লজিক এবং ডেটা ইনজেশন।
- ইউনিট টেস্টস (স্কোরিং রুলস): প্রতিটি রুলকে কনট্রাক্ট হিসেবে ট্রিট করুন—নির্দিষ্ট সিগন্যাল দেয়া হলে প্রত্যাশিত প্রভাব স্কোর ও প্রভাবিত স্কোপ assert করুন। বাউন্ডারি টেস্ট অন্তর্ভুক্ত করুন।
- ইন্টিগ্রেশন টেস্টস (ইনজেশন): ওয়েবহুক/ইভেন্ট ইনপুট থেকে নরমালাইজড রেকর্ড ও গণনাপর্যন্ত পুরো পাথ ভ্যালিডেট করুন—রিয়েল টুলগুলোর রেকর্ড করা পে-লোড ব্যবহার করুন।
পাছের দিকে রিকনস্ট্রাকশন (replay) মোড ব্যবহার করুন: ঐতিহাসিক ইভেন্ট টাইমস্ট্যাম্পের ওপর চালান এবং সম্পর্ক করুন যে সিস্টেমটি তখন কী দেখাতো বনাম পরে কি সিদ্ধান্ত নেয়া হয়েছিল।
How should we plan deployment, scaling, and iteration after the MVP?
এমভিপি ছাড়ার পরে দ্রুত পরিবর্তনের জন্য সেই ডেপ্লয়মেন্ট স্টাইল বেছে নিন যা বদলাতে সহজ: সাধারণত মডুলার মনোলিথ দিয়ে শুরু করুন—একটি অ্যাপ + ব্যাকগ্রাউন্ড ওয়ার্কার্স + দরকার হলে ইনজেশন এজ আলাদা রাখুন।
স্টোরেজ বেছে নিন ব্যবহার প্যাটার্ন দেখে:
- কোর সত্তাগুলোর জন্য রিলেশনাল DB (Postgres/MySQL)
- হাই-ভলিউম সিগন্যালের জন্য টাইম-সিরিজ বা কলামনার স্টোর
- গ্রাফ DB কেবল তখন বিবেচনা করুন যখন ডিপেন্ডেন্সি কুয়েরি বটোকম জটিল হয়
আরও: নিজের অ্যাপকেও পর্যবেক্ষণ করুন—এরর রেট, ধীর এন্ডপয়েন্ট, ইনজেশন থ্রুপুট, ডেটা ফ্রেশনেস ইত্যাদি দেখাবেন UI-তে যাতে রেসপন্ডাররা সংখ্যাগুলো বিশ্বাস করতে পারে।